Looking to create a Pinterest strategy that offers low risk and high rewards?
There’s a mountain of free data waiting to help you do just that.
Discover what your audience craves, what they interact with, and what makes them click, click, click – learn how to use Pinterest analytics today!
Master everything you need to know about Pinterest analytics to build a thriving social community in this complete guide for beginners.
Plus, we’ve included 3 strategies you can use to grow your audience, engage your followers, and boost traffic to your website — using Pinterest analytics.
Never be intimidated by analytics again!
This step-by-step guide starts from at the beginning and walks you through everything you need to know to use Pinterest like a pro.
You’ll discover:
- What Pinterest analytics can do for your brand
- How to access Pinterest analytics
- Understanding Pinterest Analytics
- How to use Pinterest analytics to grow your audience
- How to use Pinterest analytics to boost brand engagement
- How to use Pinterest analytics to drive traffic to your website
- How to Setup Pinterest Analytics for Business Infographic
What Pinterest Analytics Can Do for Your Brand
Pinterest analytics show you how pinners are viewing, sharing, and engaging with your content.
You can also learn more about your Pinterest audience such as their age, location, and what types of content they engage with most.
All this information helps you to create more of the content your audience loves by tailoring your pins to their personality, interests, and favorite types of content.
[tweetshare tweet=”The data, charts, and lists you’ll find in Pinterest analytics are super-easy to understand and navigate once you begin viewing them on a regular basis.” username=”sharelovapp”]
However, getting started might demand a bit of your time as you learn to understand and interpret the statistics.
We’ve got you covered.
This article will help you cut down on the time it takes to learn Pinterest analytics by explaining it clearly and answering all your questions.
We’ll also show you precisely what statistics to watch so you can meet your goals – without getting overwhelmed by the possibilities.
Let’s start by taking a look at how to get Pinterest analytics set up for your brand.
How to Access Pinterest Analytics
In this section, we’ll show you how to get started with Pinterest analytics.
Besides tracking the activity your account gets on Pinterest, the analytics program can also track and report on activity coming from your website and some of your social media accounts.
Follow the 4 steps below to access your Pinterest analytics and integrate your account with your website and social media accounts.
Step 1: Open a Pinterest Business Account
If your brand already has a Pinterest business account, you can skip this step.
You must have a business account to access Pinterest Analytics.
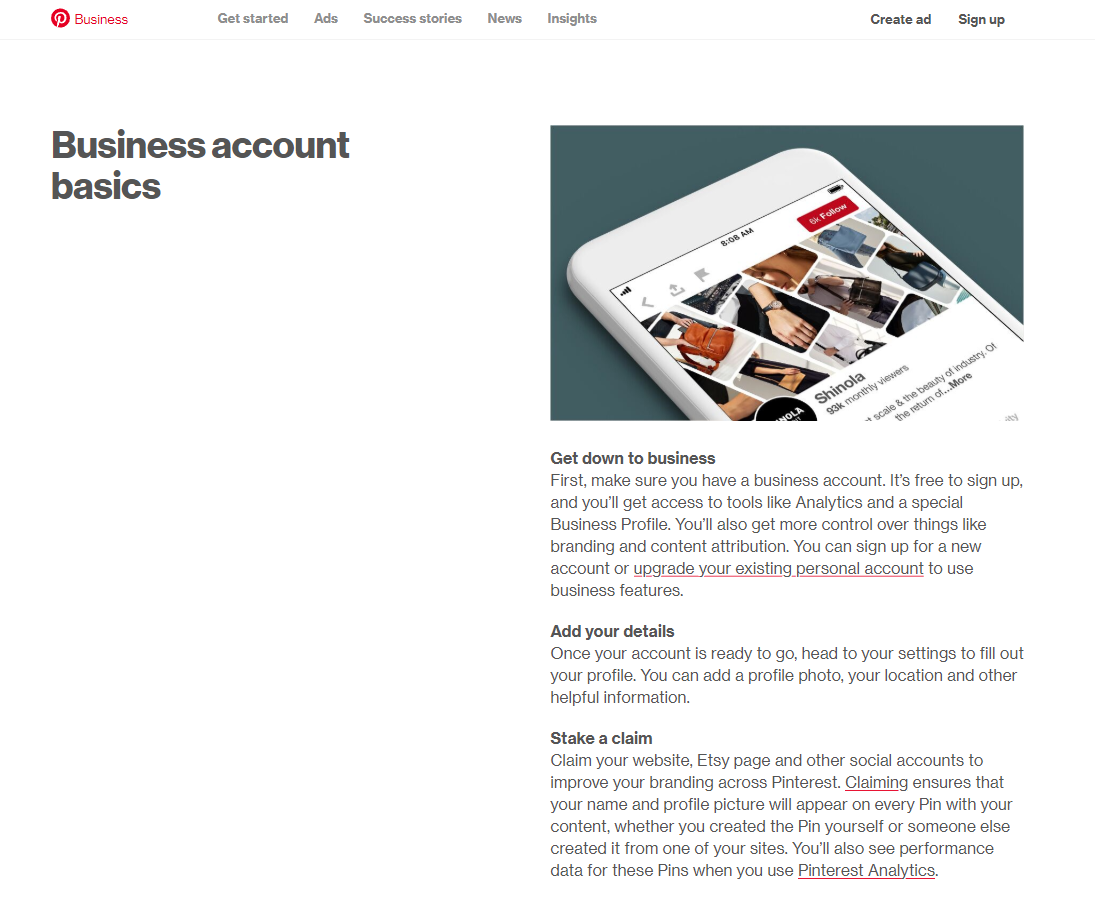
Fortunately, creating a business account is simple and doesn’t cost a thing.
You can convert your personal profile to a business profile or create a brand-new account for your business. And, it only takes a minute.
If you haven’t completed this step yet, go ahead and open your Pinterest business account right now – before you read any further.
To create a new Pinterest for business account:
- Log out of your personal Pinterest account
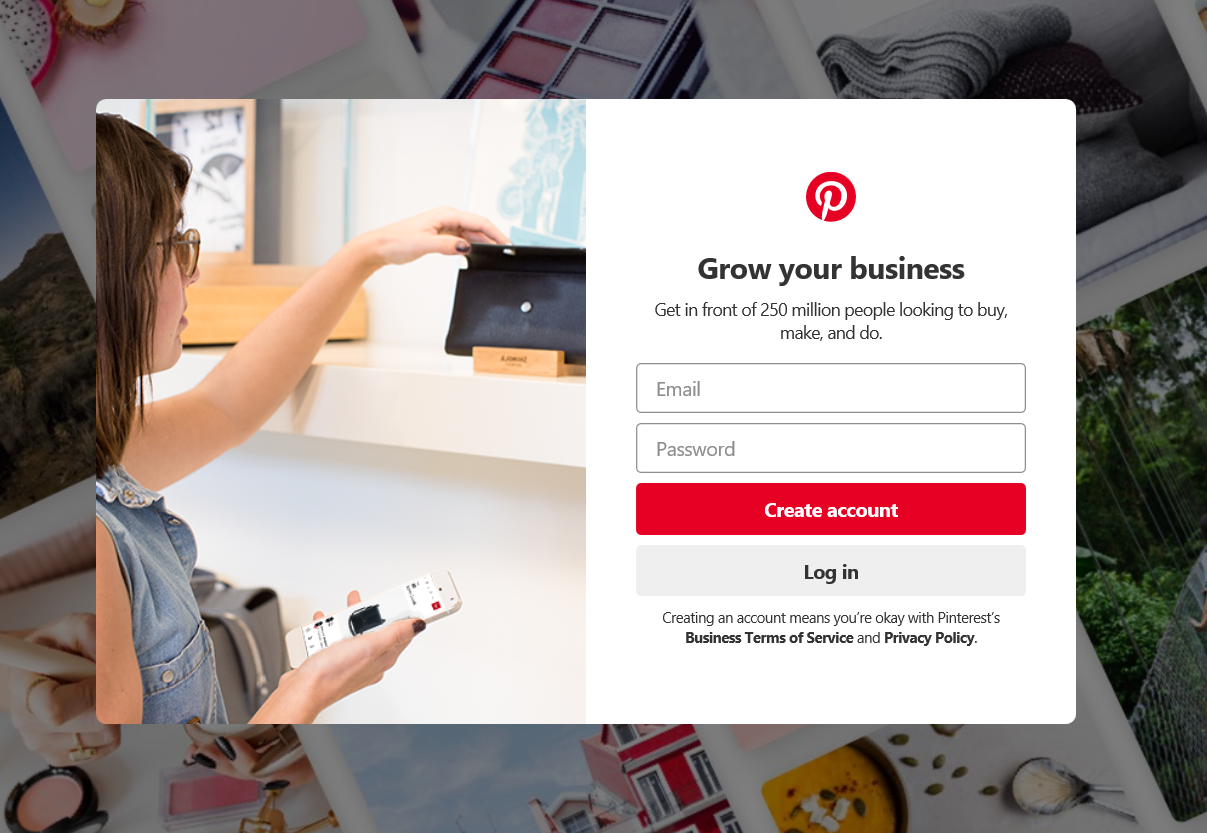
- Go to https://www.pinterest.com/business/create/, where you’ll fill in your business email and create a password for your account.
From there, you’ll fill out the information needed to complete your account. Then you’ll be ready to start pinning.
If you’re new to Pinterest for business, be sure to check out our Ultimate Guide to Pinterest 2019 for tips and instructions on how to get started!
If you’ve already got an active following and boards on Pinterest, you may prefer to convert your current account to a business account, instead of starting from scratch.
To convert your personal Pinterest account to Pinterest for business:
- Log into your Pinterest account.
- Go to https://www.pinterest.com/business/create/
- Fill out the form that asks for your business name and website.
- Click “create,” and you’re all set!
Once your business account is created, you’ll have access to Pinterest analytics, which you can find in the upper left corner of any page.
Step 2: Claim Your Website
Pinterest website analytics are some of the most helpful metrics you have access to. They tell you what content people love best and keep track of what pinners are saving from your site.
Some analytics are available to you without claiming your website, however, you’ll need to take this step and the next one (adding a “save” button) to take full advantage of all the statistics Pinterest offers.
To claim your website, follow any of the prompts on your Pinterest analytics charts or pages.
You’ll be asked to add a line of code to your website’s head section or upload an HTML file.
It can take 24 hours to get verified and begin working, so claim your site right away if possible!
Step 3: Add a Pinterest “Save” Button
Encourage your site visitors to share your content to Pinterest with the save button.
The save button is a clickable Pinterest logo that allows people to share content from your site to Pinterest.
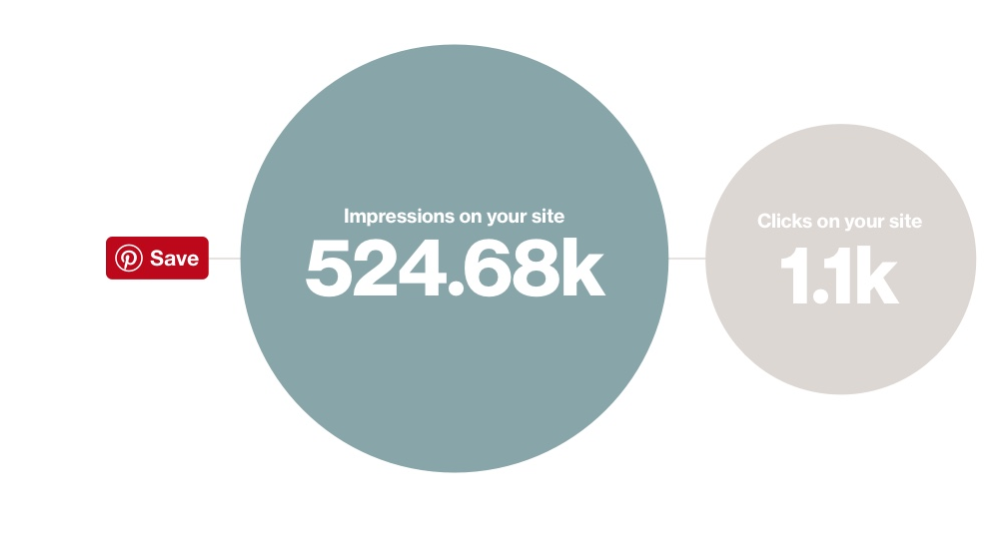
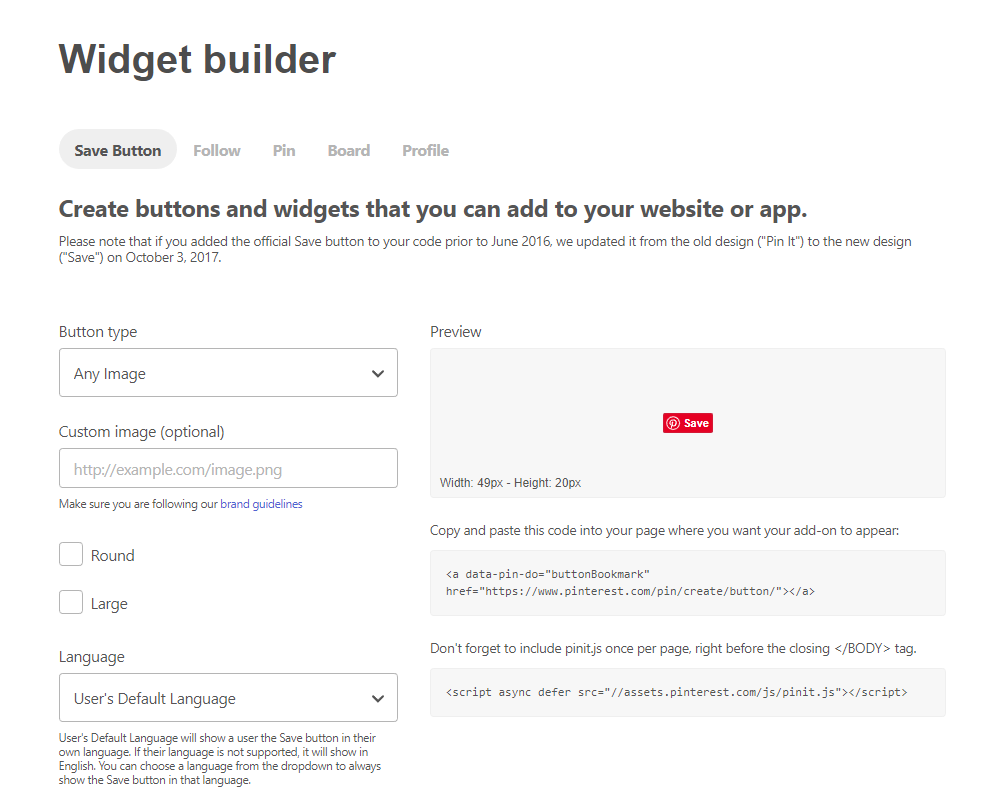
To add the Save button to your site, use the Pinterest Widget Builder or grab the code from the Pinterest Developers page
The widget builder allows you to customize the button type, shape, image, and language of the save button you want to use on your site.
To add the Save button to your site, use the Pinterest Widget Builder or grab the code from the Pinterest Developers page
The widget builder allows you to customize the button type, shape, image, and language of the save button you want to use on your site.
Step 4: Claim Your Social Media Accounts
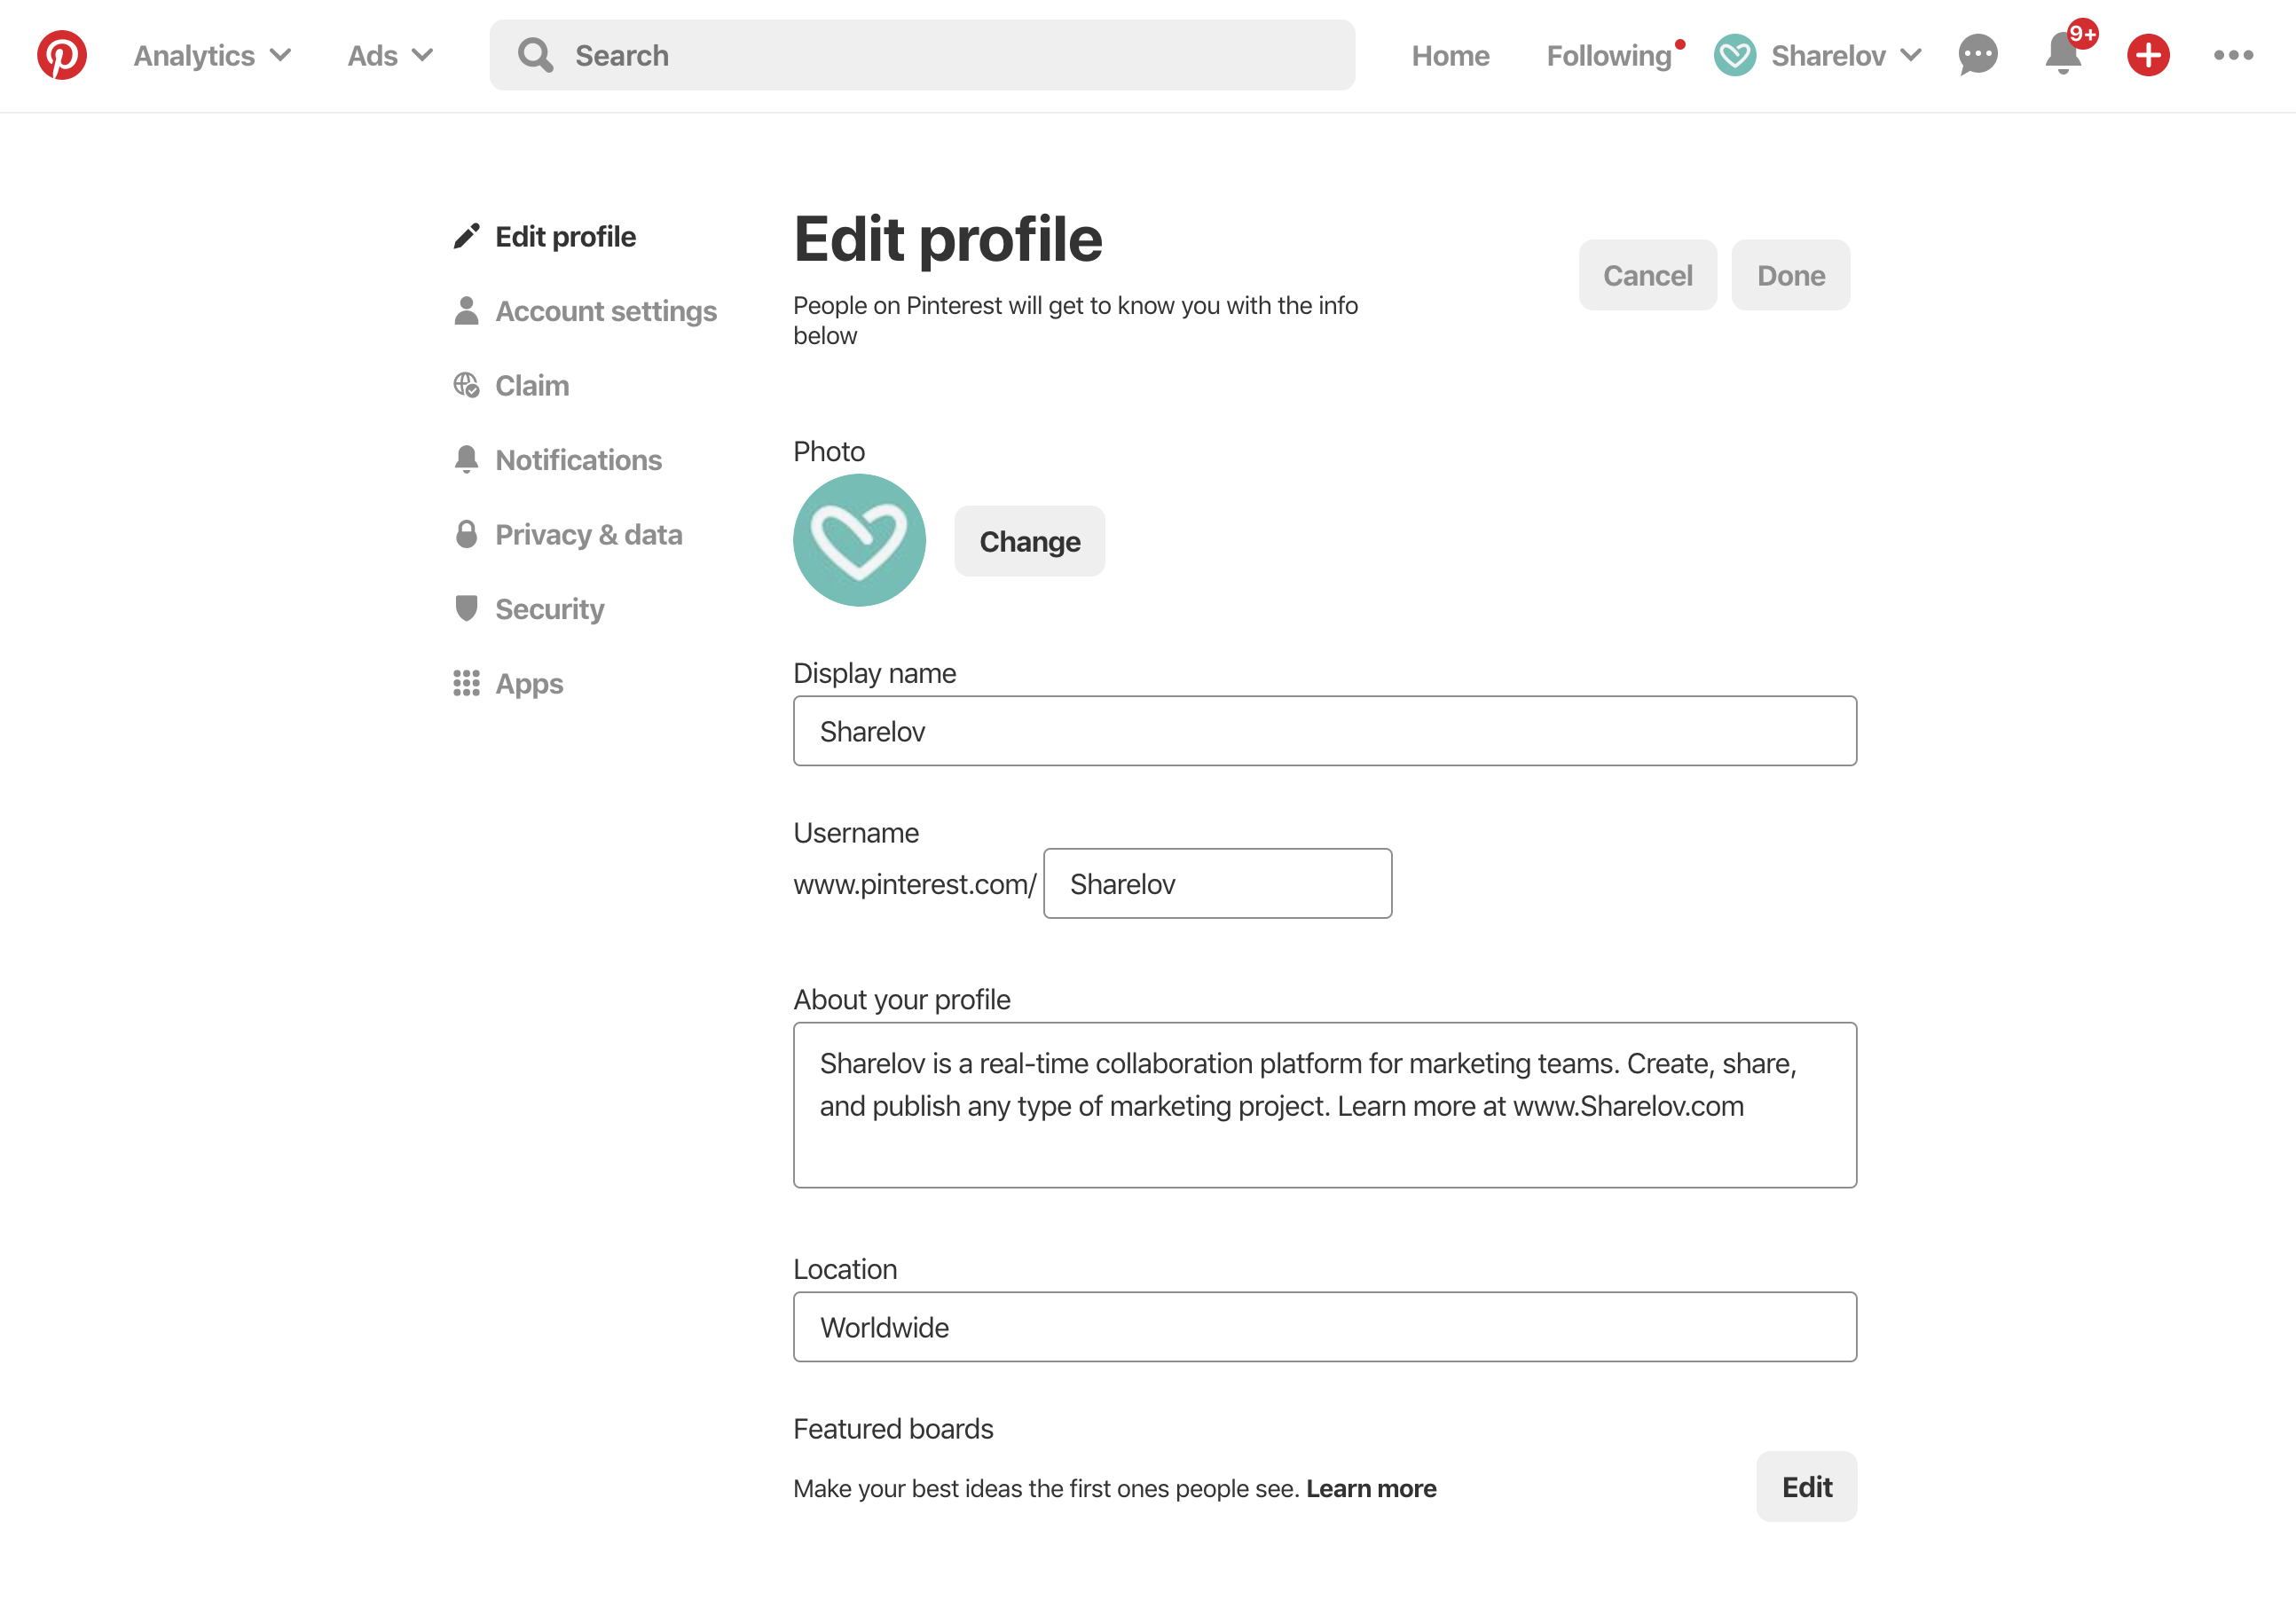
Include pinned content from other social networks into your Pinterest analytics.
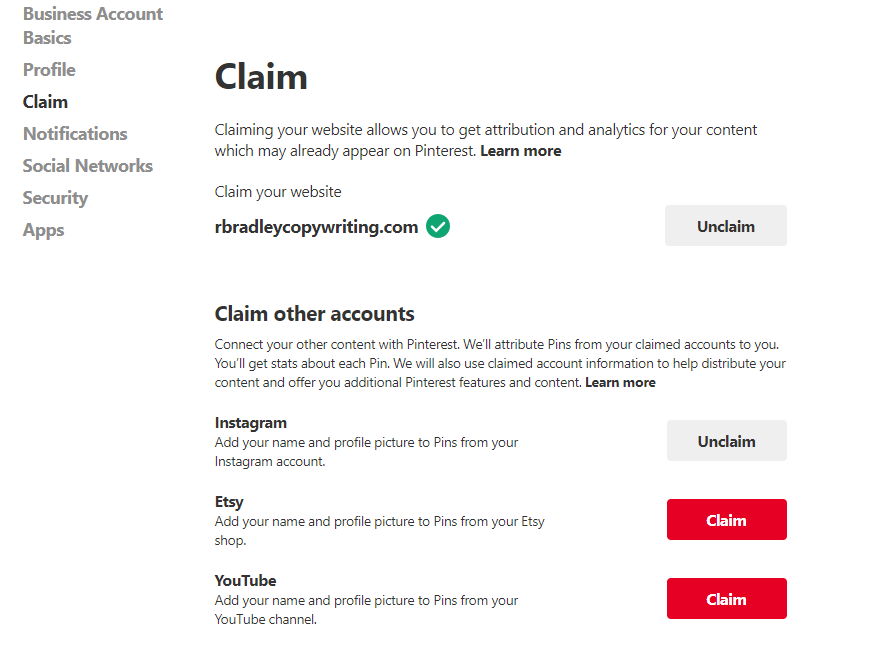
Pinterest allows you to claim your YouTube, Instagram, and Etsy accounts so you can track pins coming from those social sites as well.
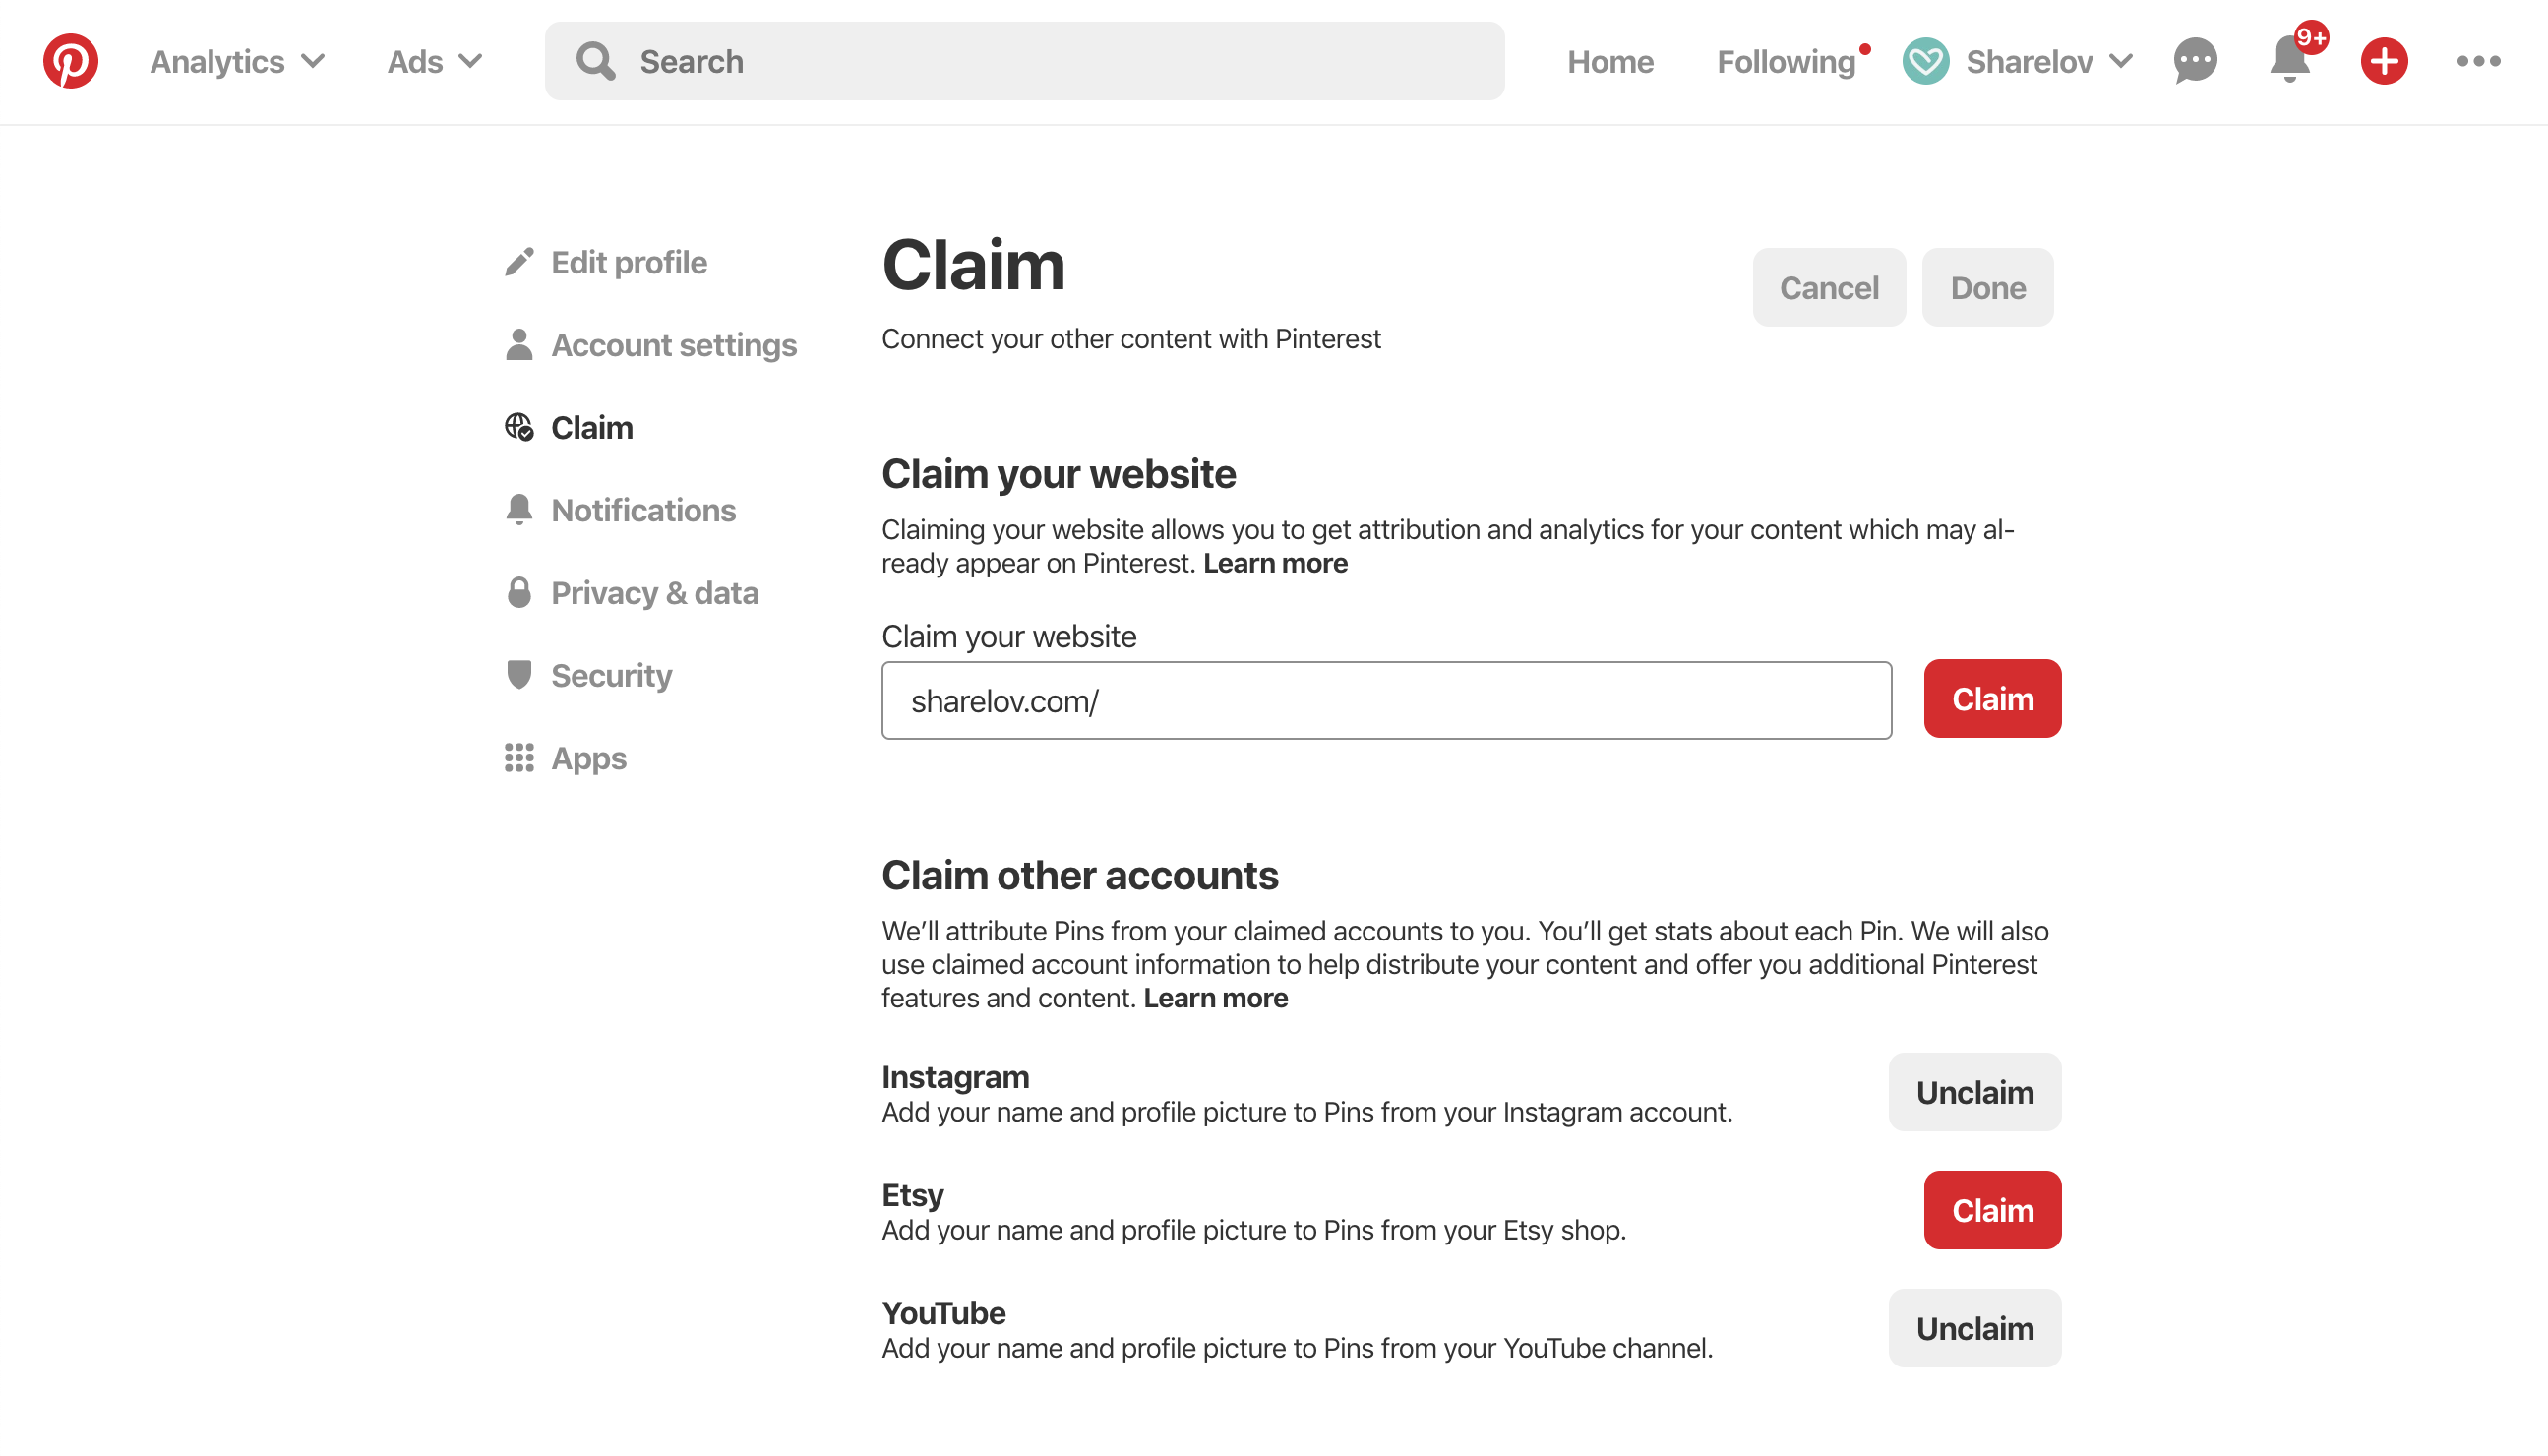
To claim your social media accounts, visit Pinterest settings>>Claim.
Select “claim” next to the accounts you want to claim, then follow the onscreen instructions to link your accounts.
Once you’ve finished the steps above, you’ll be ready to access all the data available to you in the analytics program.
To access Pinterest Analytics look for the “analytics” button.
This may look different on other devices, however, Pinterest makes it super easy to find and access this program, no matter what device you’re using.
Understanding Pinterest Analytics
Include pinned content from other social networks into your Pinterest analytics.
Pinterest allows you to claim your YouTube, Instagram, and Etsy accounts so you can track pins coming from those social sites as well.
To claim your social media accounts, visit Pinterest settings>>Claim.
What is Overview Analytics?
Include pinned content from other social networks into your Pinterest analytics.
Pinterest allows you to claim your YouTube, Instagram, and Etsy accounts so you can track pins coming from those social sites as well.
To claim your social media accounts, visit Pinterest settings>>Claim.
Your Pinterest profile: This panel offers a brief look at the average number of daily impressions and viewers your profile has had over the last week, plus the percent change (up or down) during the same period.
 Tapping “more” takes you to the impressions section for your pins (explained below).
People you reach: This panel offers a brief look at your average monthly viewers and engagements, plus the percent change (up or down) during the same period.
Tapping on “more” takes you to an interactive chart that allows you to view how many viewers and engagements your profile received on any date during the selected time period.
Activity from your company: This panel offers a brief look at your average daily impressions and viewers, plus the percent change (up or down) during the same period.
Tapping the “more” button takes you to an interactive chart that allows you to view how many viewers and engagements your profile received on any date during the selected time period.
Top pin impressions: This is a list that shows which pins got the highest number of impressions over the past 30 days, and lists the number of impressions, saves, and clicks for each pin, next to the pin type.
Overview analytics is an excellent tool for daily Pinterest insights. It only takes a quick glance at overview analytics to stay informed about your most crucial metrics.
Use the Overview section in-between your regular deep-dive weekly and monthly research.
What Is Profile Analytics?
Profile analytics let you know how your pinned profile content is performing across Pinterest.
Pinterest’s profile analytics offer insights into how your profile pins are performing.
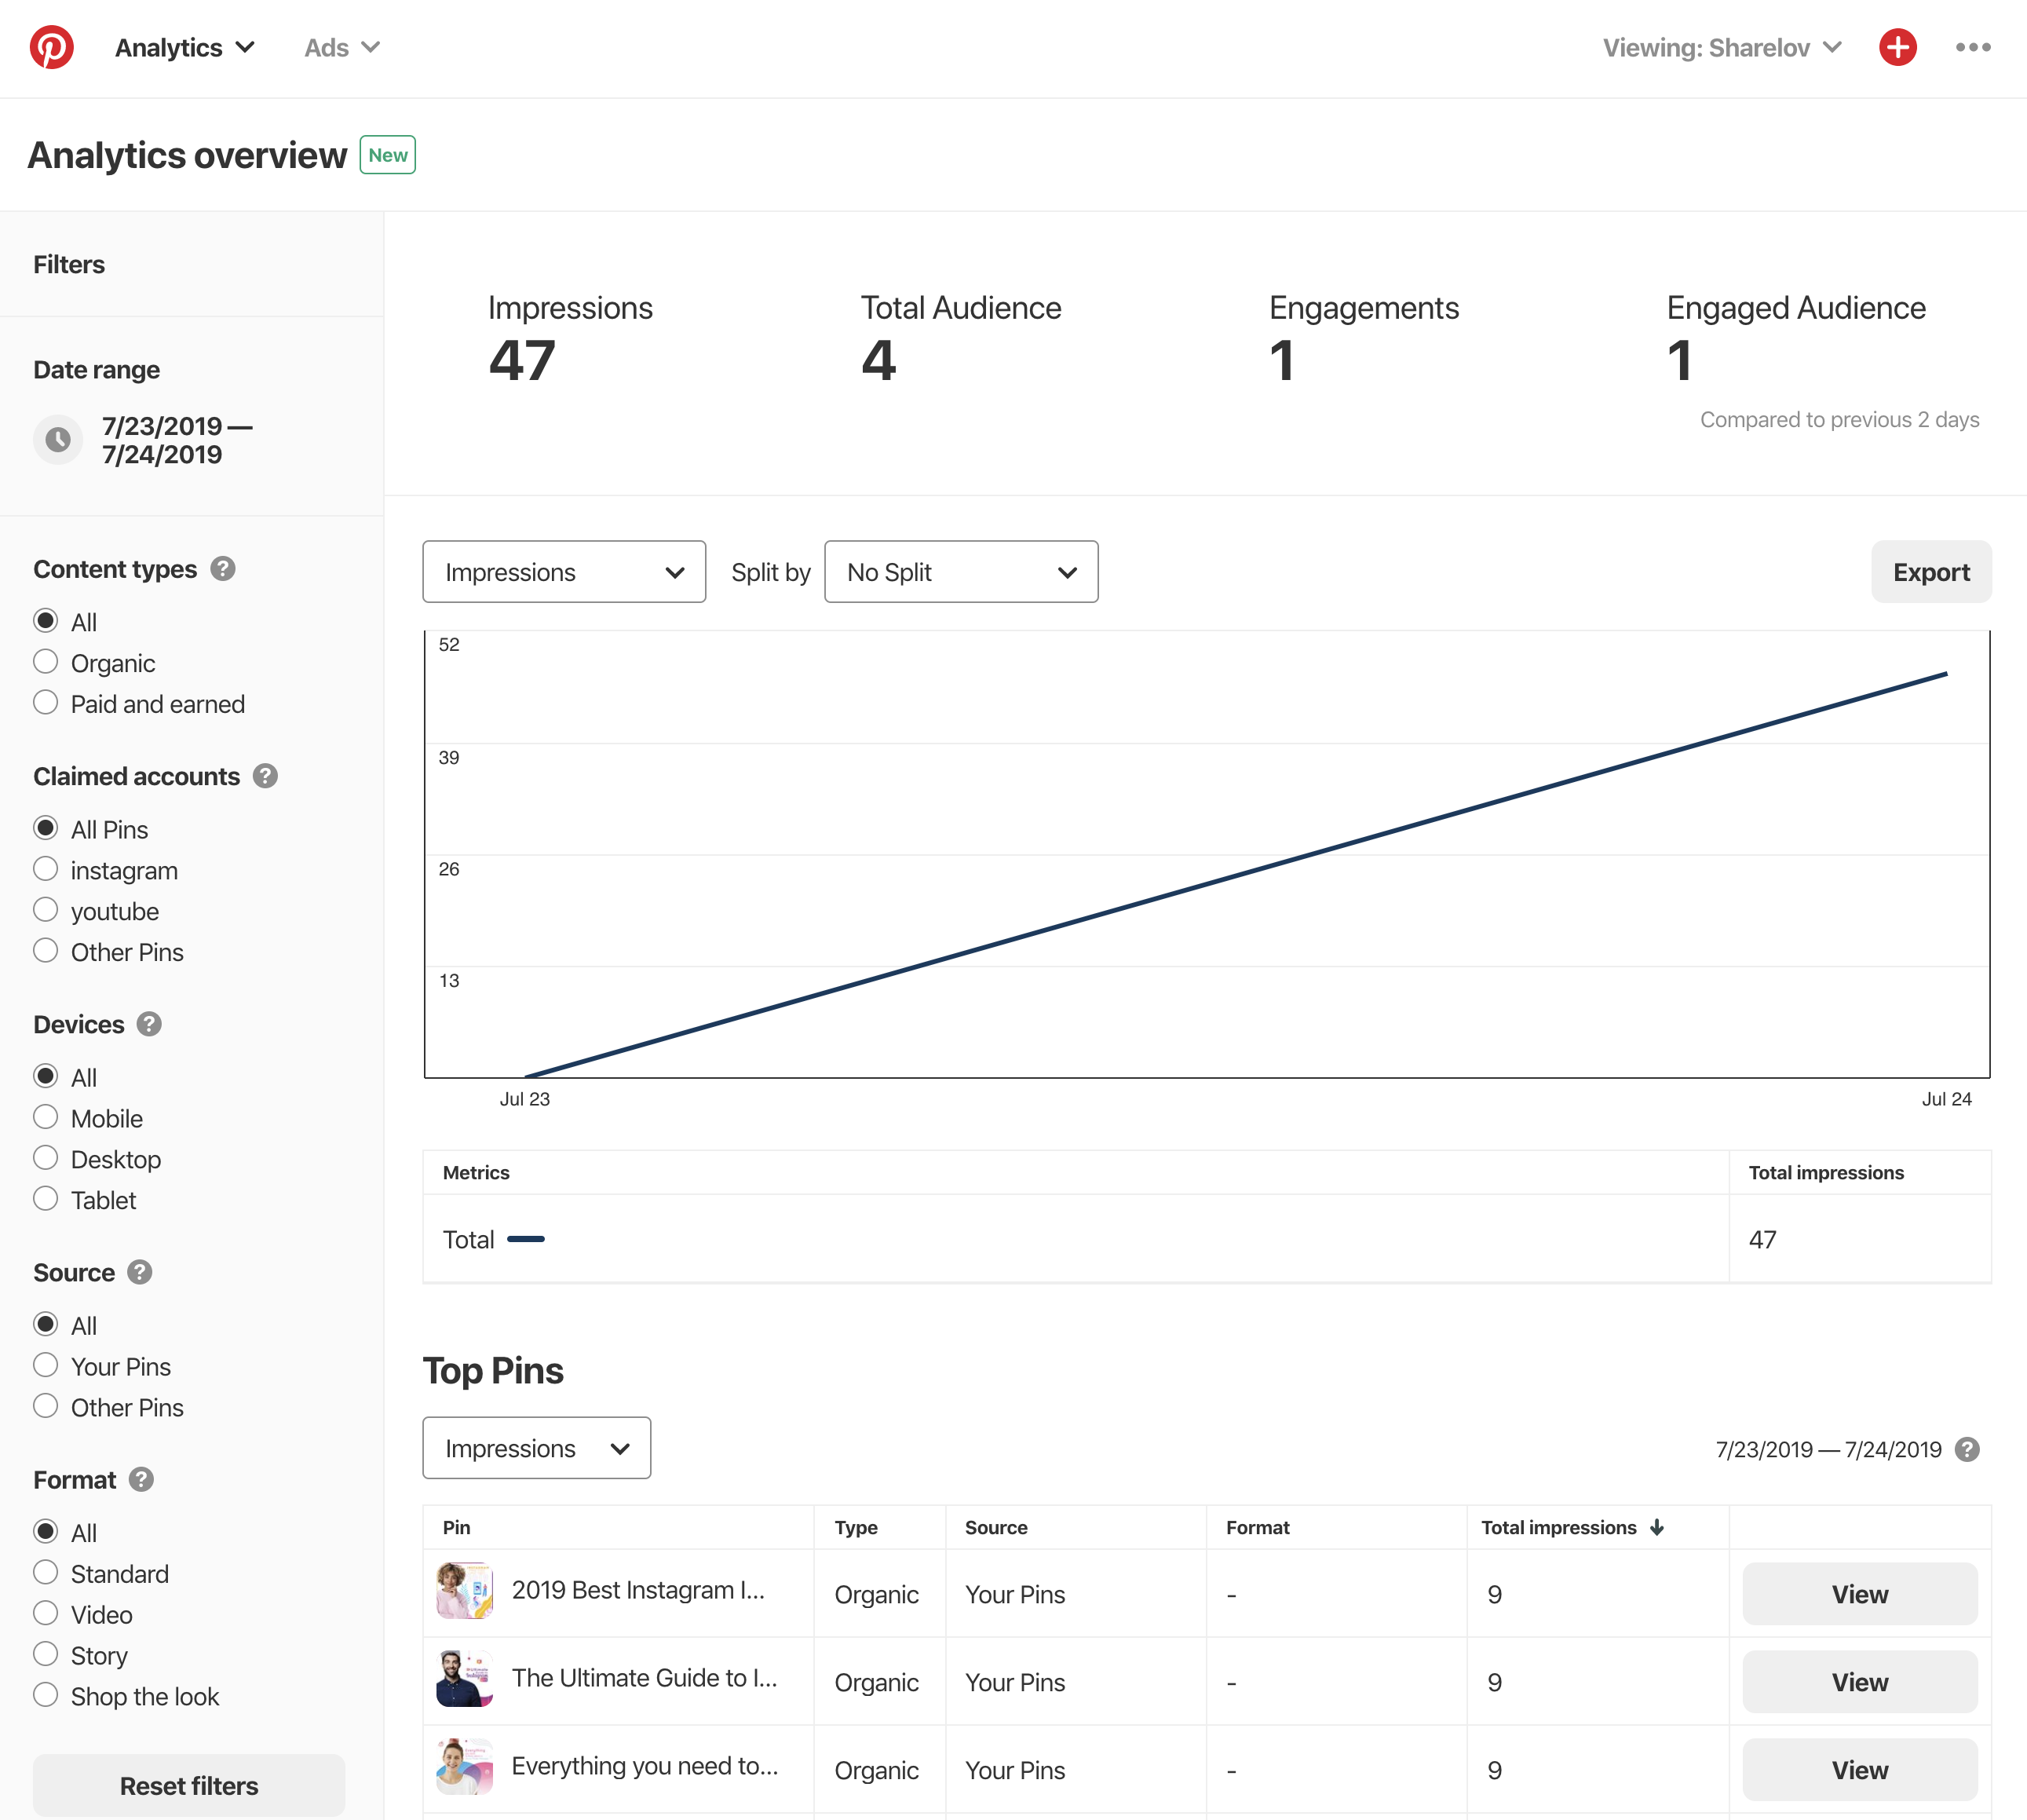
All of the data in this section can be exported using the “export data” tool in the upper right corner of the page.
Profile Impressions: How Many Times Your Profile Pins Show Up In A Feed
A drop-down box at the top of this section offers you a choice of viewing data for the past 7, 14, or 30 days.
View the following information about your profile impressions:
- Average daily impressions, plus the percent change (up or down) during the same period
- Average daily views, plus the percent change (up or down) during the same period
- An interactive chart allows you to view how many impressions and viewers your profile received on any date during the selected time period
The profile impressions section also includes 2 lists:
- Top pin impressions from the previous 30 days, including impressions, clicks, saves, and pin type
- Boards with top pin impressions from the previous 30 days, including impressions, clicks, saves, and number of pins
Profile Saves: How Many Times People Saved Your Profile Pins
A drop-down box at the top of this section offers you a choice of viewing data for the past 7, 14, or 30 days.
View the following information about your profile saves:
- Average daily saves, plus the percent change (up or down) during the same period
- Average daily people saving, plus the percent change (up or down) during the same period
- An interactive chart allows you to view how many saves and people saving on any date during the selected time period
The profile saves section also includes 2 lists:
- Pins people save most from the previous 30 days, including saves, impressions, clicks, and pin type
- Boards with the pins people save most from the previous 30 days, including saves, impressions, clicks, and number of pins
Profile Clicks: How Many People Clicked Through To Your Website
A drop-down box at the top of this section offers you a choice of viewing data for the past 7, 14, or 30 days.
View the following information about your profile impressions:
- Average daily clicks, plus the percent change (up or down) during the same period
- Average daily visitors, plus the percent change (up or down) during the same period
- An interactive chart allows you to view how many clicks and visitors you had during a selected time period
The profile saves section also includes 2 lists:
- Most clicked pins from the previous 30 days, including clicks, impressions, saves, and pin type
- Boards with the most clicked pins from the previous 30 days, including clicks, impressions, saves, and number of pins
Profile All-time: Your Top-performing Pins
This section of your profile analytics includes 3 lists:
- Most saves: lists your most shared pins of all time
- Best in search: shows which pins rank higher in searches
- Power pins: A listing of your most successful pins – the ones with the highest mix of saves, clicks, and more.
What Is People You Reach Analytics?
People you reach shows the number of average monthly viewers and engagements your brand had on Pinterest.
A scroll-over chart allows you to view the dates when people saw and interacted with your pins.
Top tabs in this section allow you to sort results by device type.
You can also choose to view the data for all audiences or only your audience.
There is an export option included.
What Is Website Analytics?
Find out how your website is affecting your Pinterest engagement by tracking data about how people share content from your site to Pinterest.
To use this part of Pinterest analytics, you must first claim your website and install the Save button.
This data in this section gives you information about the pins coming from your domain.
Drop down boxes at the top of each page offer you a choice of viewing data for the past 7, 14, or 30 days.
Impressions section: This section shows your average daily impressions and average daily viewers plus the percent change (up or down) during the same period, next to an interactive graph.
Saves section: This section shows your average daily saves and how many people saving, plus the percent change (up or down) during the same period, next to an interactive graph.
The saves section also includes the following lists:
- Pins people save most from the previous 30 days – including saves, impressions, clicks and pin types
- Boards with the pins people save most from the previous 30 days, including saves, impressions, clicks, and number of pins
Clicks section: This section shows your average daily clicks and average daily visitors back to your website, plus the percentage change (up or down) during the same period, next to an interactive graph.
The clicks section also includes the following lists:
- Most clicked pins from the previous 30 days, including clicks, impressions, saves, and pin type
- Boards with the most clicked pins from the previous 30 days, including clicks, impressions, saves, and number of pins
Original Pins section This section shows the average daily pins created from your website and the average daily number of people saving those pins. It also includes the percentage change (up or down) during the same period, next to an interactive graph.
The original pins section also includes a list of the newest pins created from your website.
All-time section: This section shows your most saves (your most-shared pins), Best in search (pins that rank higher in search), Power pins (pins with high saves, clicks, and more).
[tweetshare tweet=”Website analytics help you monitor the traffic to and from your website so you can discover what strategies are working well for your brand.” username=”sharelovapp”]
What Is Audience Insights?
The information in the audience insights section can help you get to know your target audience better so you can create detailed buyer personas.
[tweetshare tweet=”Understanding the interests and personality of your audience can help you craft content that’s more likely to engage them.” username=”sharelovapp”]
Categories & Interests
This chart displays the most popular categories and interests of your current audience.
For example, in the sample below you’ll notice that weddings are the most popular interest for this audience and design is the 2nd most popular.
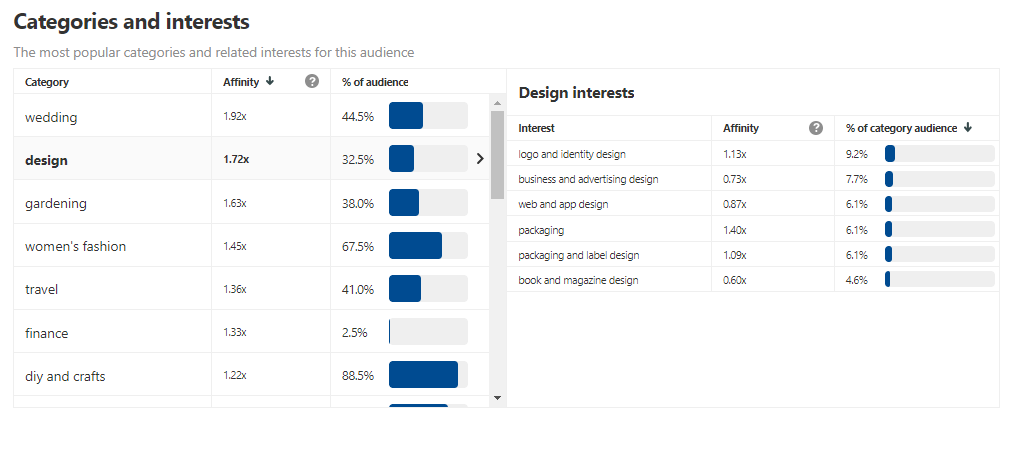
Clicking on any of the topics opens up a chart with more details on the right-hand side.
In this example, you’ll notice that when I click on the design row, it opens up a chart showing what types of design the audience is most engaged with.
From this chart, we learn that this audience loves logo, business, advertising, and web designs. This helps guide content planning for future posts on Pinterest.
Age and Gender
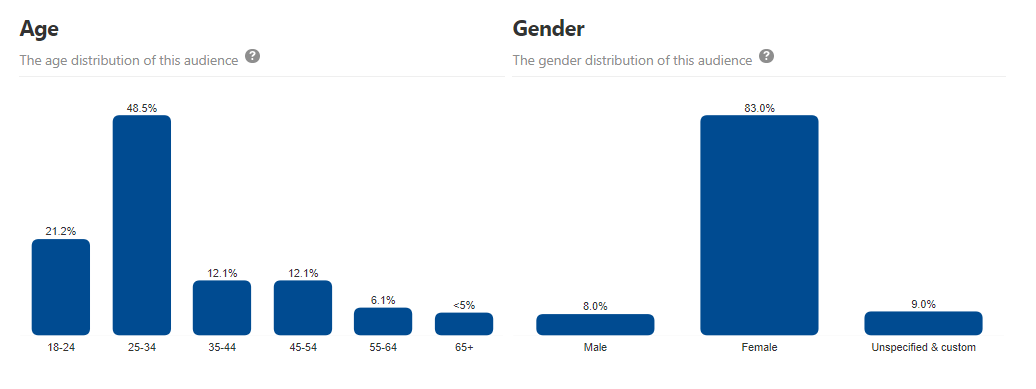
The age and gender chart allows you to get to know your audience better by forming a simple buyer persona.
Location
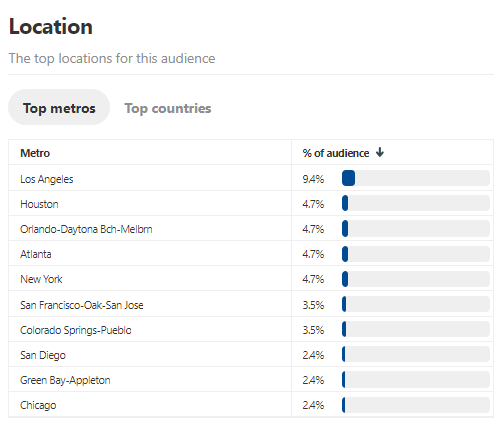
The location chart offers insights into:
- The percent of your audience closest to popular metro areas, under “top metro”
- The countries that your audience is located in.
For example, you’ll notice in the sample below that over 40% of the audience is in the U.S. and nearly 10% comes from Los Angeles.
Device
Find out what devices your audience is using to view and interact with your pins.
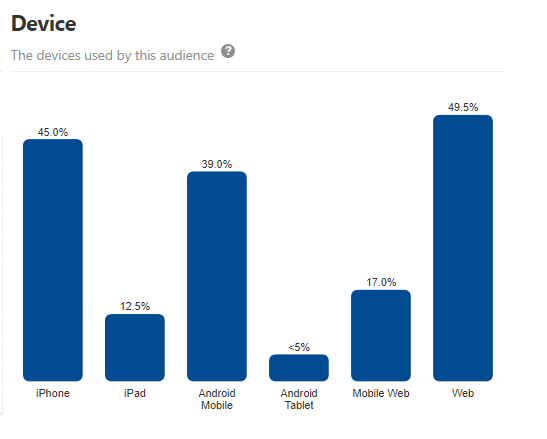
Many people use more than one type of device to access Pinterest. For example, one person might use an iPhone during the day, an iPad in the evening, and a web browser on the weekends. The Pinterest device stats list all the ways your audience uses devices.
These stats account for all the different devices your audience uses.
Audience Insights for ALL Pinners
[tweetshare tweet=”Audience insights for all pinners is a super-helpful section of Pinterest analytics where you can spot upcoming trends and popular topics.” username=”sharelovapp”]
These insights offer a peek into the personality and behavior of the entire Pinterest community.
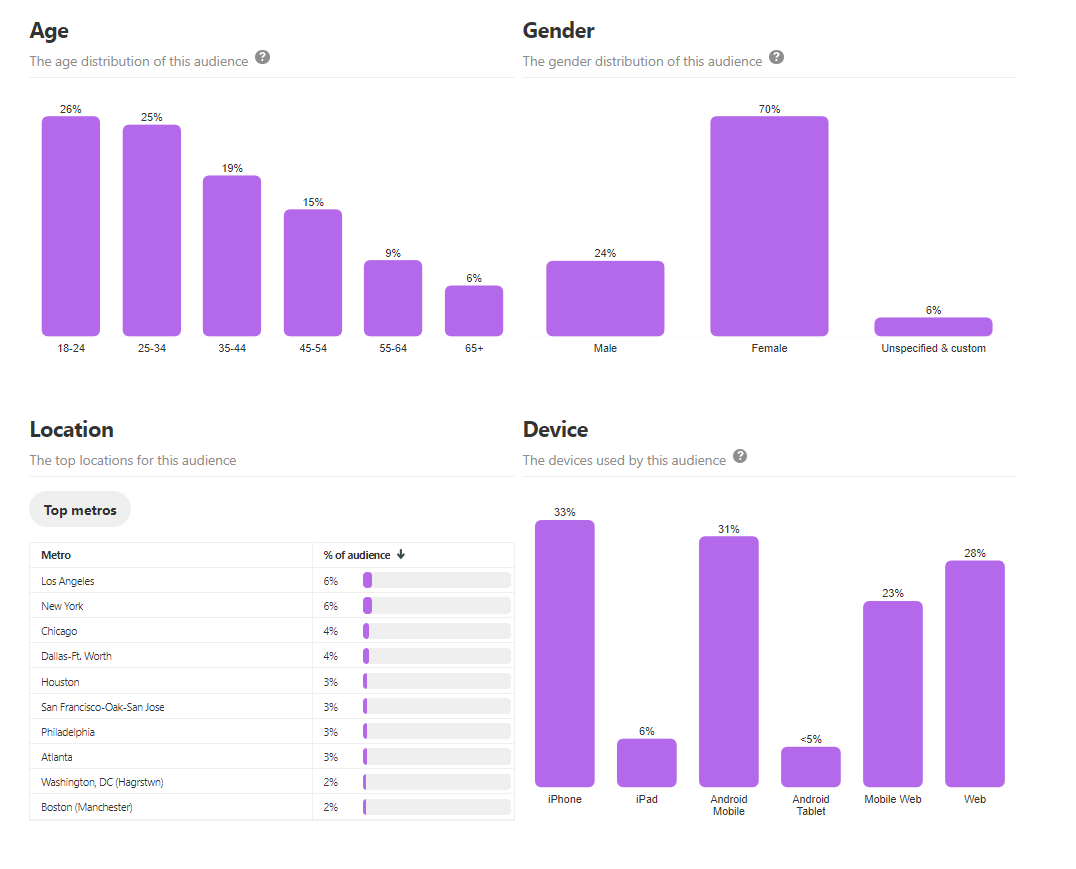
It’s also good to know that the “age” category, while helpful, is only as accurate as people are forthcoming. Many pinners aren’t willing to share their age, and these people aren’t reflected in the demographics.
Audience Insights, Compared
This section allows you to view a side-by-side comparison of your audience versus the entire Pinterest community.
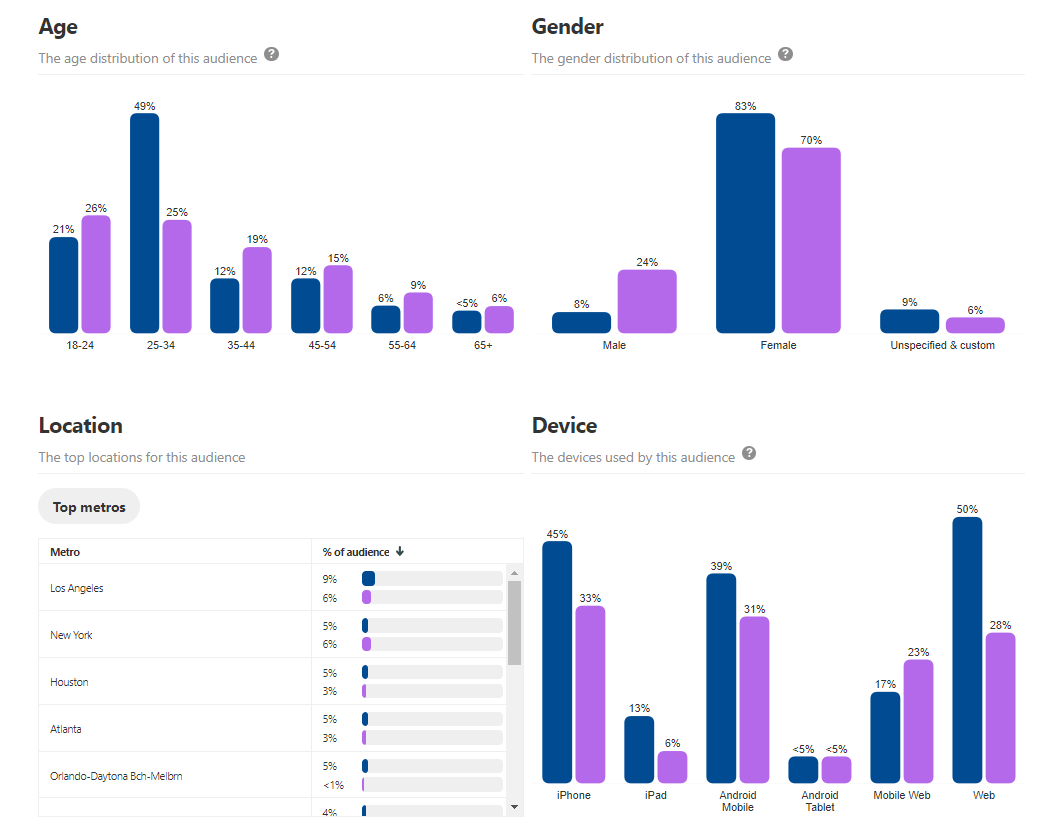
The visual charts can help you identify areas where you can grow or further niche your audience.
How to use Pinterest Analytics to Grow Your Audience
The Audience Insights section offers data that can help expand your reach and grow your audience more quickly.
Here’s one way to grow your following on Pinterest using analytics.
Study Your Audience Insights
- Study the categories and interests section of your audience insights to learn what’s trending with your audience right now.
For example, if you’re a restaurant that wants to please a health-conscious audience, then click on the “health” category in your list.
The expanded “health interests” chart will give you a good idea what type of health-related content is most popular right now.
[tweetshare tweet=”If “diet and nutrition” is favored by 65% of your Pinterest audience, but “healthy food” is an interest for only 13%, then create content around the diet and nutrition theme.” username=”sharelovapp”]
Monitor your audience insights to learn what’s trending with the people that follow you on Pinterest, then give them more of what they love!
You can take this a step further by comparing your own audience with the entire Pinterest community in the “compare” section to see if there are more opportunities to create content that people are actively looking for.
How to use Pinterest Analytics to Boost Brand Engagement
Your Pinterest profile analytics and audience insights sections offer information that can help boost engagement from your Pinterest followers.
To increase brand engagement on Pinterest, find out what type of content your audience likes to engage with, and give them more of it.
Some of the metrics that can help you with this are:
- Your Pinterest profile>All-time
-
- Your most-shared pins
- Power pins (pins with a high mix of saves and clicks)
-
- Your Pinterest profile > Saves > Past 30 days
-
- Pins people save most
- Boards with pins people save most
-
- Your Pinterest profile > Clicks > Past 30 days
-
- Most clicked pins
- Most clicked boards
-
- Audience Insights> Your engaged audience
- Categories and interests
You can use these stats to discover what content, categories, and interests inspire your audience to interact with your brand.
Pay special attention to the types of content and formats that inspire engagement.
[tweetshare tweet=”Look for patterns in your highest and lowest-performing pins, and seek out answers as to why your audience engages – or doesn’t engage – with your pins.” username=”sharelovapp”]
This can take time and testing, but it’s a highly effective way to learn how your audience likes to interact.
Check your analytics on a regular basis so that you can catch new trends and changes that can help you to keep your engagement rates high.
How To Use Pinterest Analytics To Drive Traffic To Your Website
[tweetshare tweet=”Optimize your landing pages and descriptions, then track website activity clicks and power pins to help drive traffic to your website.” username=”sharelovapp”]
Pinterest analytics offers helpful information that can increase the amount of traffic you drive to your website. In this section, we’ll explain which metrics can help you drive traffic to your site.
Since click-throughs are heavily dependent on how well you optimize your pins, we’ve also included a couple optimization tips to help you get started.
Begin by optimizing your landing pages.
Ensure that all your branded and linked pins take pinners to the content they’re hoping for. For example, if your pin is “How to create a tile backsplash,” its link should take the user straight to step-by-step instructions for the backsplash.
Next, optimize your pin descriptions.
Using full sentences, describe your pin clearly, including relevant keywords, and a clear call-to-action. And don’t forget to work those hashtags!
Track your metrics
The most helpful sections, when you want to drive more traffic to your website from Pinterest, are
- Website activity: Clicks – Average daily clicks and visitors
This section shows you how many average daily clicks and visitors your pins produce. This is helpful because you can find out when your pins begin to drive more (or less) traffic.
- Website activity: Clicks – Most clicked pins
- Website activity: Clicks – Boards with the most clicks
Follow the lists in your website analytics clicks section to learn about your popular pins and boards. Boards with the most clicks can offer clues into the topics that pinners are most likely to click on.
Your most clicked pins provide insights into what’s inspiring people to click through to your website.
Look for patterns in your most successful pins and boards because they can help you create more clickable pins.
Another metric that can help improve your clicks is power pins.
- Website activity: All-time – Power pins
The Power pins chart is the last list on the website activity – all time section of your Pinterest analytics.
This chart shows you which of your pins are getting an all-around high rating, including a mix of saves, clicks and more.
When you notice a pin that ranks as both a power pin and a most clicked pin, consider creating more like it. If you haven’t already, you might want to turn these types of pins into promoted pins.
One Minute a Day Can Give You a Giant Edge on Pinterest
It doesn’t take long to get the “hang” of using Pinterest analytics. It’s one of the most intuitive programs you’ll ever use, yet it offers truckloads of information that can help your brand succeed.
Once you develop the routine of checking your analytics on a regular basis, it takes only seconds to review the metrics.
Some people prefer the “jump in and cross your fingers” approach to social media. Professional marketers, however, take a more calculated path to success, especially with a platform like Pinterest that offers a sophisticated (yet simple) analytics program.


