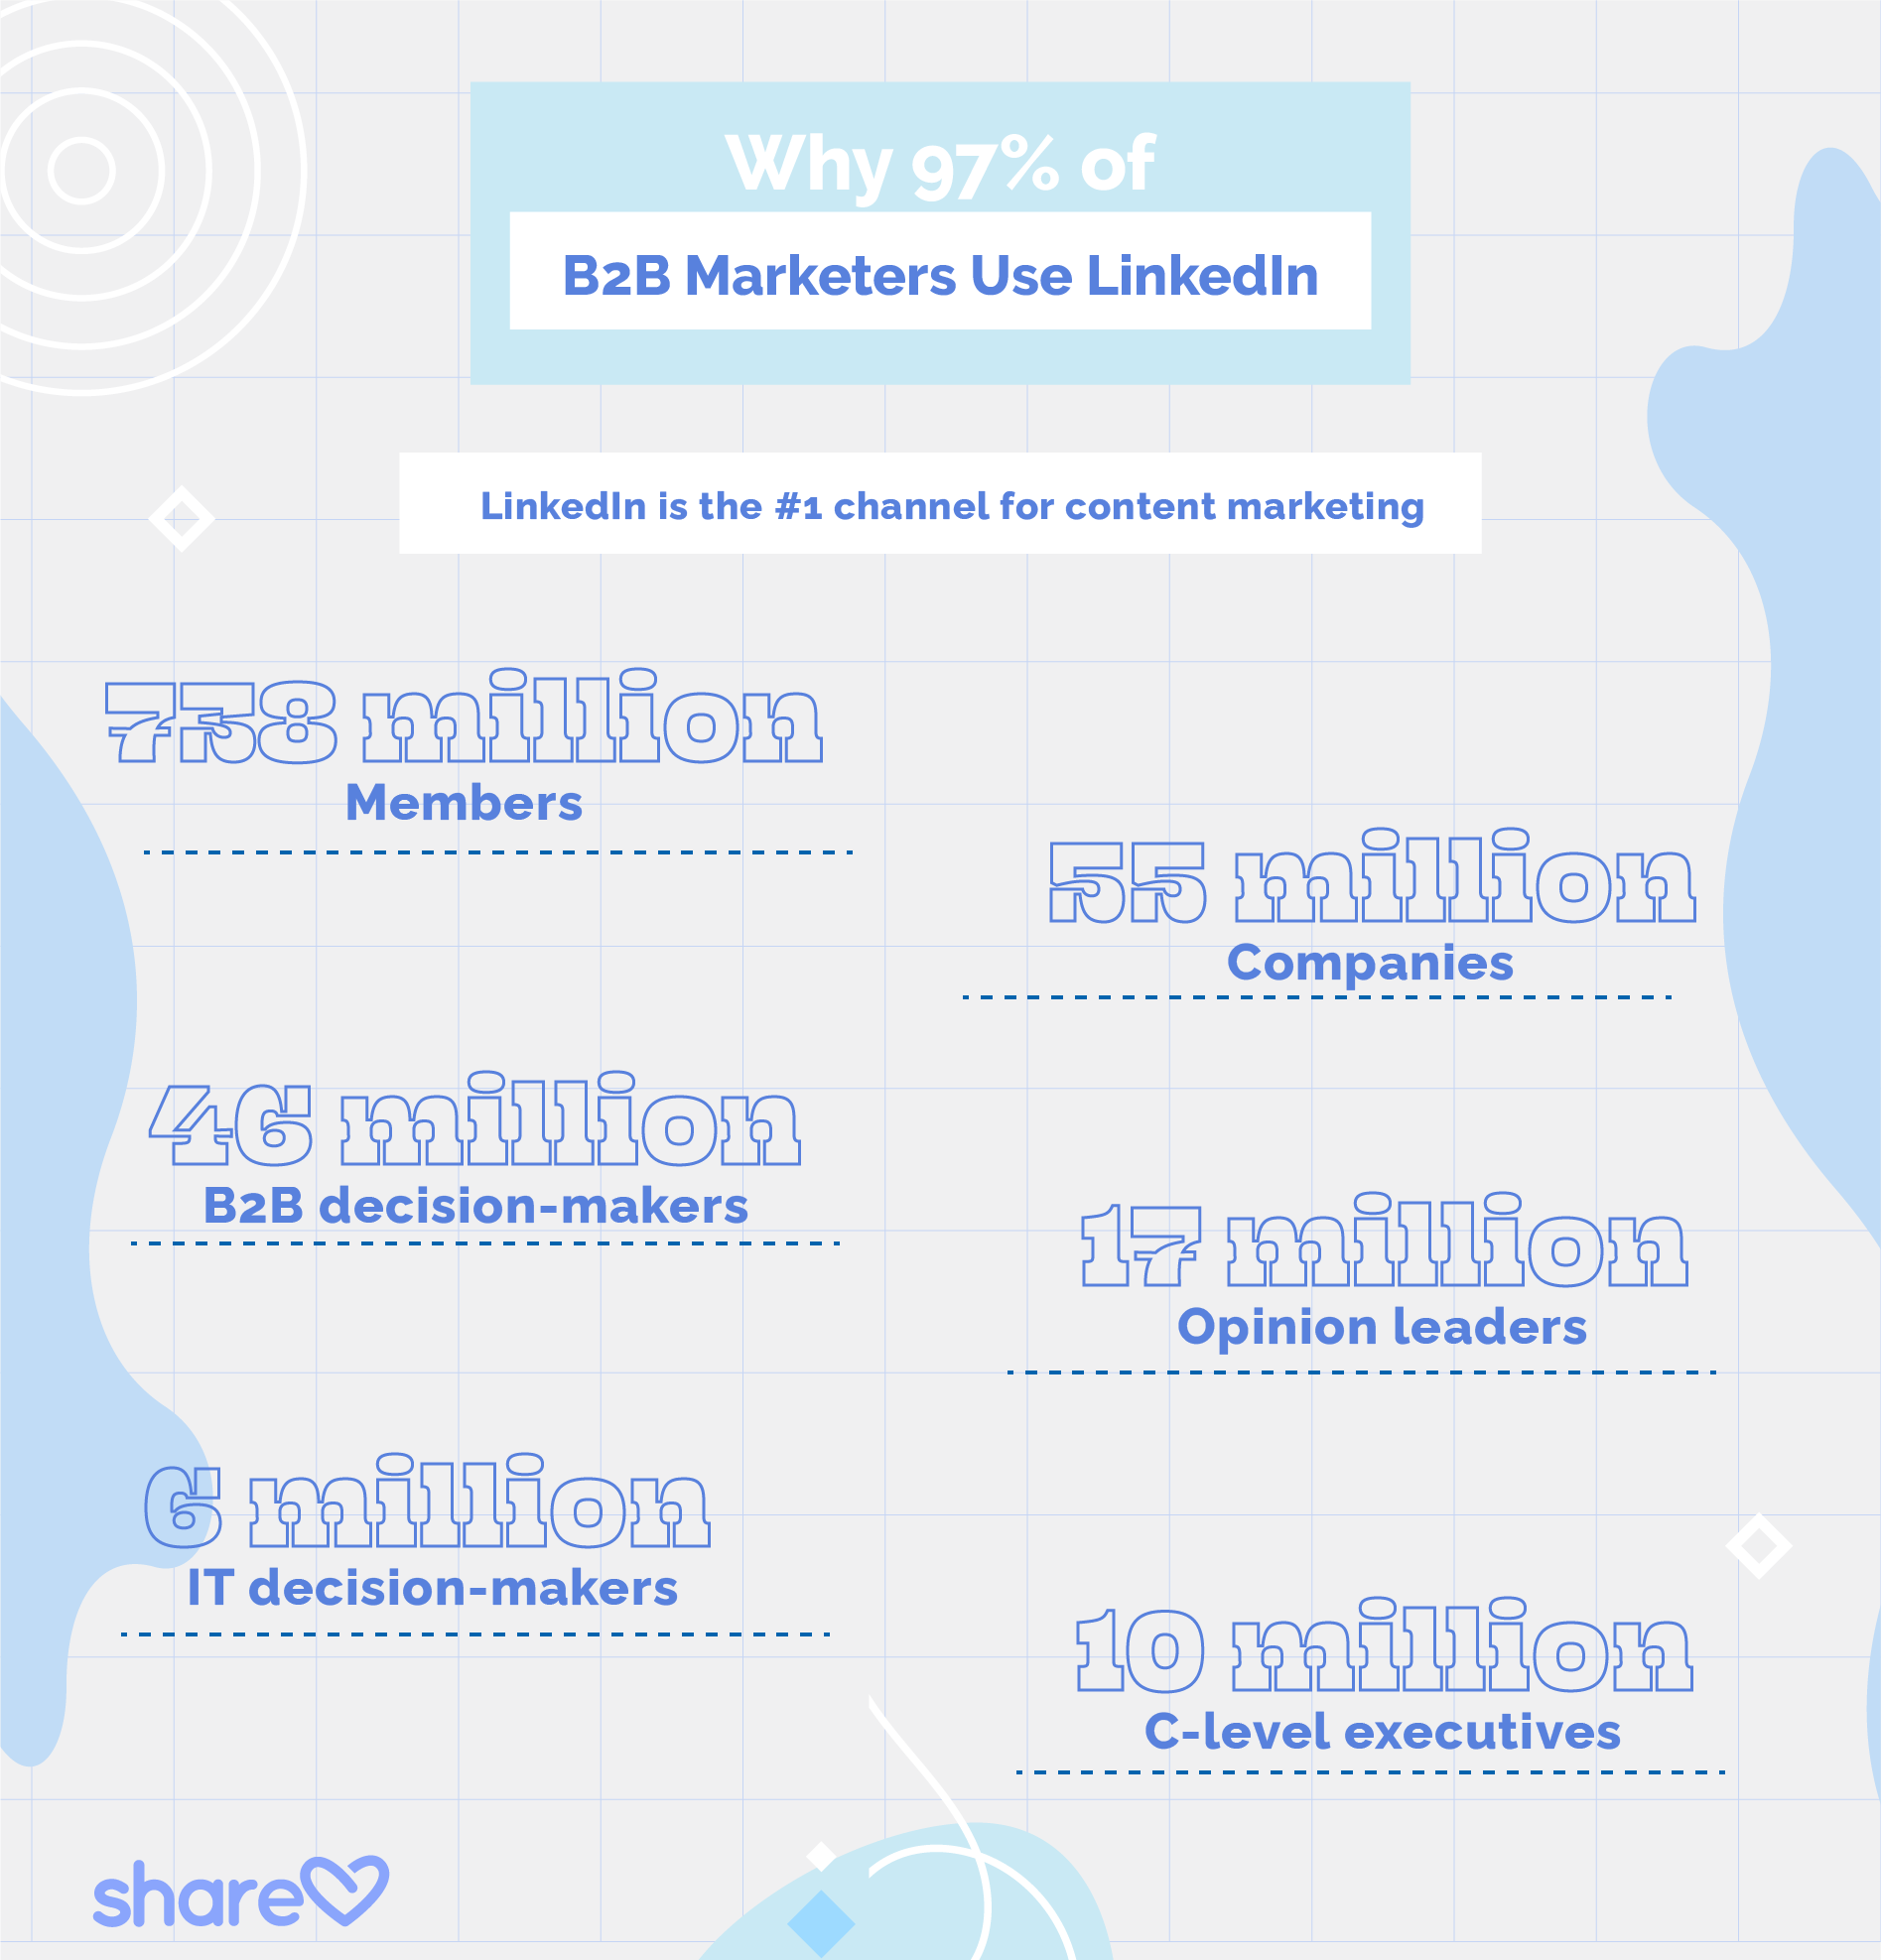
LinkedIn is HUGE for B2B business professionals — nearly all B2B Marketers (97%) use the platform for content marketing.
That’s great, but…
How are you going to get your brand to stand out on a platform where all the world’s marketers are competing for attention?
We’ve got you covered.
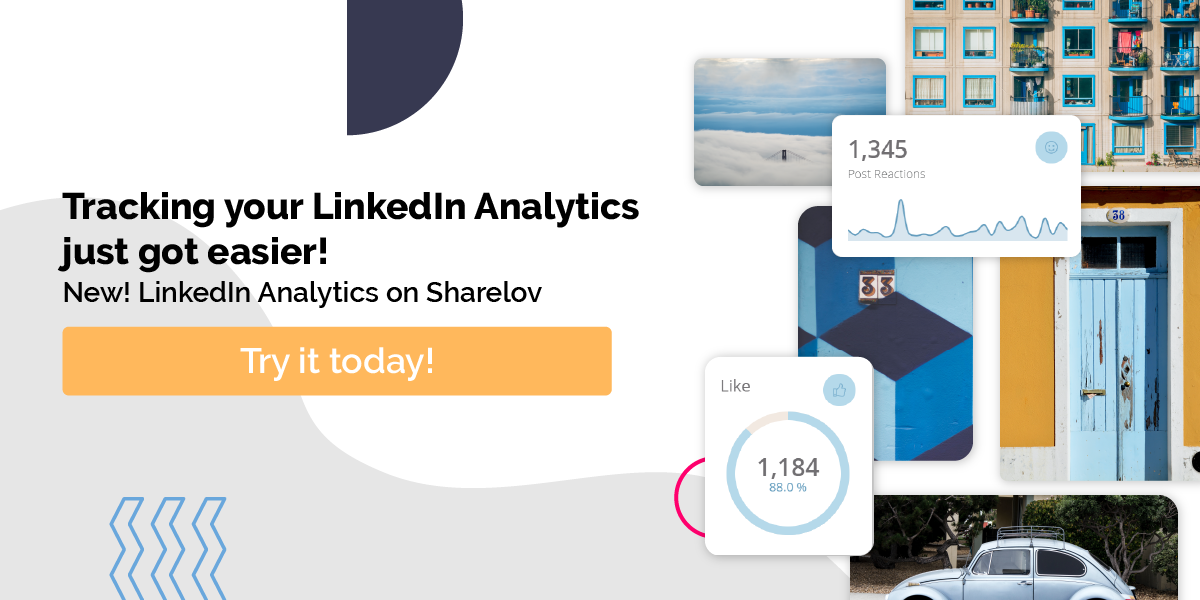
This is the Ultimate Guide to LinkedIn Analytics in 2021.
If you want to use LinkedIn to:
- Get people to consider your product
- Develop leads for your business
- Send more traffic to your website
- Boost your conversions
Keep reading.
By the time you finish this guide, you’ll understand how to use analytics to help you build professional relationships and achieve your marketing objectives on LinkedIn.
More than 730 million members are waiting to meet you.
Ready to get started?
Why LinkedIn Analytics Matters To Marketers
How important is LinkedIn and Page insights to B2B marketers?
Inside LinkedIn Pages Analytics
Understanding LinkedIn Company Page and Updates (post) statistics
How To Make LinkedIn Analytics Easier For Teams
10 reasons your team will love Sharelov’s LinkedIn Analytics feature
Why LinkedIn Analytics Matters To Marketers
LinkedIn is home to the largest professional networking group that exists.
Its 738 million members and 55 million companies include:
- 46million B2B decision makers
- 17 million opinion leaders
- 6 million IT decision makers
- 10 million C-level executives
Yet, logging onto LinkedIn doesn’t feel like you’re entering a crowded stadium.
Instead of entering into a massive crowd of strangers, LinkedIn greets you with familiar faces that are looking forward to engaging you in conversation and introducing you to their colleagues.
The platform is such a natural space for business professionals to network that calling it “social media” doesn’t seem right.
All the negatives that give most social media channels a bad name are, for the most part, absent on LinkedIn.
Trolling, fake news, and angry debates are few and far between.
In their place, members typically find the type of respectful, productive conversations and content that lay the groundwork for authentic business networking.
Users actively seek out new partnerships, business relationships, and products or services to enhance the success of their business or career.
And that, perhaps, is why LinkedIn is the largest, most successful professional gathering place on the planet.

LinkedIn matters to marketers because it’s where people go to get serious about doing business.
LinkedIn is the #1 channel for content marketing, and nearly all B2B marketers (97%) use LinkedIn for content marketing.
LinkedIn Analytics is the key to understanding your audience and building a successful strategy on the platform.
In the following sections, we show you how to understand and apply its metrics to reach your most-important marketing objectives.
Inside LinkedIn’s Page Analytics
LinkedIn provides three types of metrics to help you evaluate the effectiveness of your brand’s presence on the platform.
- Updates analytics help you understand how well your LinkedIn Page updates (posts) are performing.
- Followers & Visitors analytics help you learn more about your audience.
- Talent Brand analytics share metrics for brands who enhance their pages with LinkedIn Career Pages (recruiting).
In this section, we show you how to access and understand the Updates and Followers & Visitors metrics, which can help you achieve your top LinkedIn marketing goals.
Updates Analytics For LinkedIn Pages
Page updates on LinkedIn are like posts on other social media platforms. Brands use Updates to share company news, upcoming releases, blog articles, helpful information, and more.
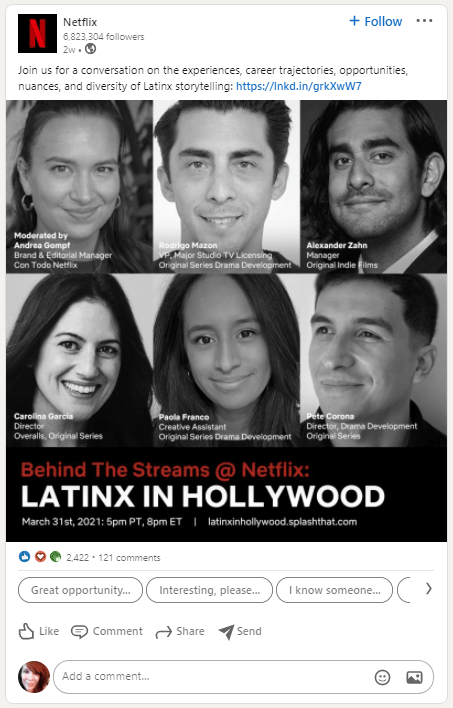
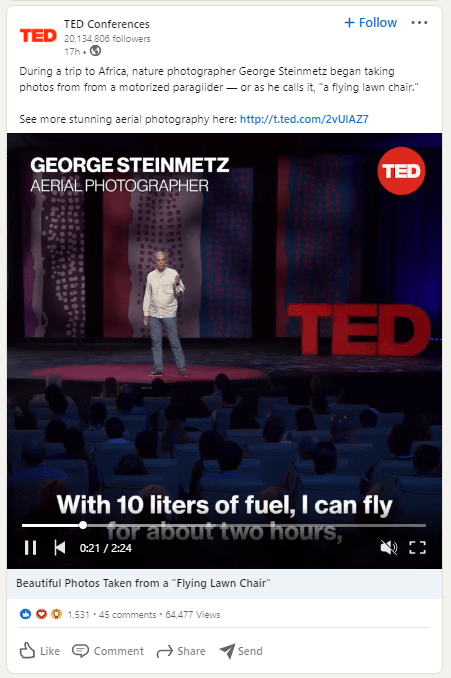
Updates also give companies the opportunity to engage with readers, and for readers to engage with each other, in the comments section.
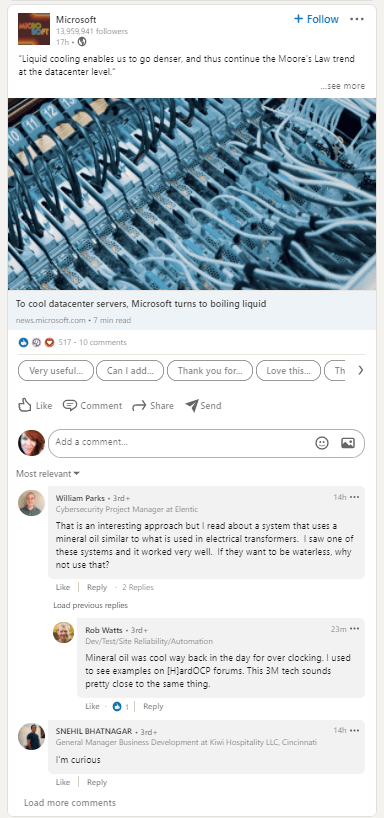
LinkedIn Analytics provides you with plenty of data to help you understand how well your posts are performing.
You must be in Admin View to access your Updates analytics. Go to your company page, then click on the analytics tab in the navigation bar and select “updates” from the dropdown.
Your Company page > Analytics tab > Updates
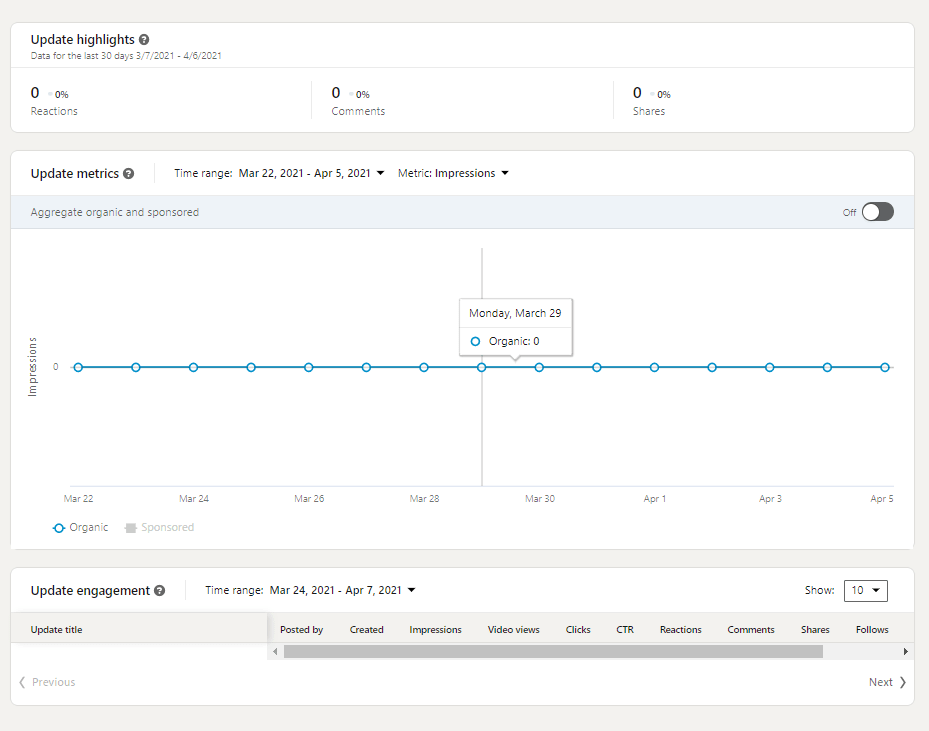
The data in your Updates section includes:
- Update Highlights show engagement metrics such as the number of likes, comments, and shares your updates received in the past 30 days, plus the percent of increase and decrease compared to the prior 30 days.
- Update Metrics shows key data on your organic and/or sponsored updates over a period of time.
- Impressions – How many times your post has been shown with at least a 50% view on a logged-in user’s device screen or browser window.
A view must last at least 300 milliseconds to be counted as an impression.
Impressions included repeat views of your update. For example, if one person views your update twice, it is counted as two impressions.
- Impressions – How many times your post has been shown with at least a 50% view on a logged-in user’s device screen or browser window.
-
- Unique impressions – Unique impressions show the number of logged-in users who saw your post.
This metric may be a more accurate representation of your reach, since it does not include repeated views the way the standard “Impressions” metric does.
- Unique impressions – Unique impressions show the number of logged-in users who saw your post.
-
- Clicks – How many times your content, company name, or logo was clicked on by a logged-in user.
-
- Reactions, Comments, and Shares – How many times users reacted, commented, or shared your content.
This metric includes direct sponsored and video posts.
- Reactions, Comments, and Shares – How many times users reacted, commented, or shared your content.
-
- Engagement rate – This metric gives you an idea of how well people are interacting with your content.
To calculate engagement rate, LinkedIn takes the number of interactions plus the number of clicks and followers acquired, and divides it by the number of impressions it received.
- Engagement rate – This metric gives you an idea of how well people are interacting with your content.
- Update Engagement metrics show per-post engagement data that you can view according to a selected or custom timeline. Update Engagement data includes:
- Impressions: How many times your post has been shown with at least a 50% view on a logged-in user’s device screen or browser window.
A view must last at least 300 milliseconds to be counted as an impression.
Impressions included repeat views of your update. For example, if one person views your update twice, it is counted as two impressions.
- Impressions: How many times your post has been shown with at least a 50% view on a logged-in user’s device screen or browser window.
-
- Video views: how many times your video was viewed for 3 seconds or more
-
- Video performance data, including
-
-
- Lifetime watch minutes (total # of times watched, including views less than 3 seconds)
- Total lifetime views (total # of times watched for at 3 seconds or more)
- Unique lifetime views (how many people watched for 3 seconds or more)
-
-
- Clicks – How many times your content, company name, or logo was clicked on by a logged-in user.
-
- CTR (click-through rate): A metric to guage the success of your clicks.
CTR is calculated by dividing the number of clicks your update received by the number of impressions.
- CTR (click-through rate): A metric to guage the success of your clicks.
-
- Reactions: The total number of reactions (Like, Celebrate, Love, Insightful, and Curious) to your update.
-
- Comments: How many comments were made on your Update
-
- Shares: How many times your Update was shared.
-
- Follows: For sponsored content, shows the number of follows you received from it.
-
- Engagement rate – This metric gives you an idea of how well people are interacting with your post.
To calculate engagement rate, LinkedIn takes the number of interactions plus the number of clicks and followers acquired, and divides it by the number of impressions it received. - Audience tab for Video: Located in the Video Analytics window, provides insights on:
- Where viewers work
- What titles viewers hold
- Where viewers are watching from
- Engagement rate – This metric gives you an idea of how well people are interacting with your post.
Updates Analytics give marketers insights on how well their content is performing on LinkedIn.
By tracking your most viewed and engaging content, you can identify what types of content and captions your audience responds to.
Over time, you want to build on your most successful types of content and publish at the best times for your audience to increase your shares, reactions, and comments.
Followers & Visitors Analytics For LinkedIn Pages
Followers & Visitors analytics help you learn more about the people in your audience. The metrics reflect your Page’s performance with data that gives you insights on your visitor traffic and demographics trends.
You can access your LinkedIn Followers & Visitors Analytics on the left side of your All Pages or Home tab in Admin View.
- Follower Highlights: Shows how many people have followed your LinkedIn Page since it was created.
Follower Highlights also shows you how many followers your Page has gained or lost in the past 30 days, along with the percent of change. - Follower Metrics: Shows how the number of your followers has changed over a given period of time, depending on what timeline you choose.
- All Followers: Shows information about your current followers, including:
- Place of employment
- When they began following your Page
- Follower Demographics: Gives you insights about your following, notated in percentages, for:
- Location
- Job function
- Seniority
- Industry
- Company size
- Companies To Track: Allows you to discover how your performance on LinkedIn compares to similar organizations (pre-determined, not selected by you), with data such as:
- Total followers
- New followers
- Number of updates
- Engagement rate
LinkedIn Followers & Visitors metrics let you know whether you’re reaching your target audience on its platform. It’s an excellent tool for helping you to gauge your success toward building the best audience for your brand.
How To Make LinkedIn Analytics Easier For Teams
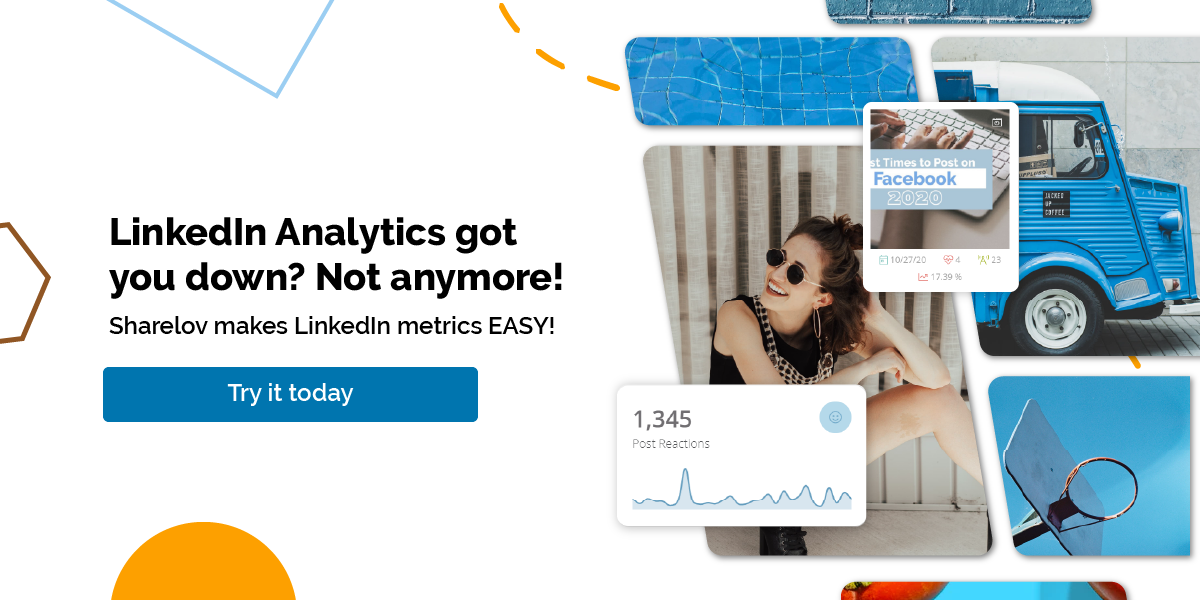
If you’re serious about your success on LinkedIn and plan on reviewing your insights regularly, you may want to consider using an interface that’s more visual and makes reporting/reviewing quicker.
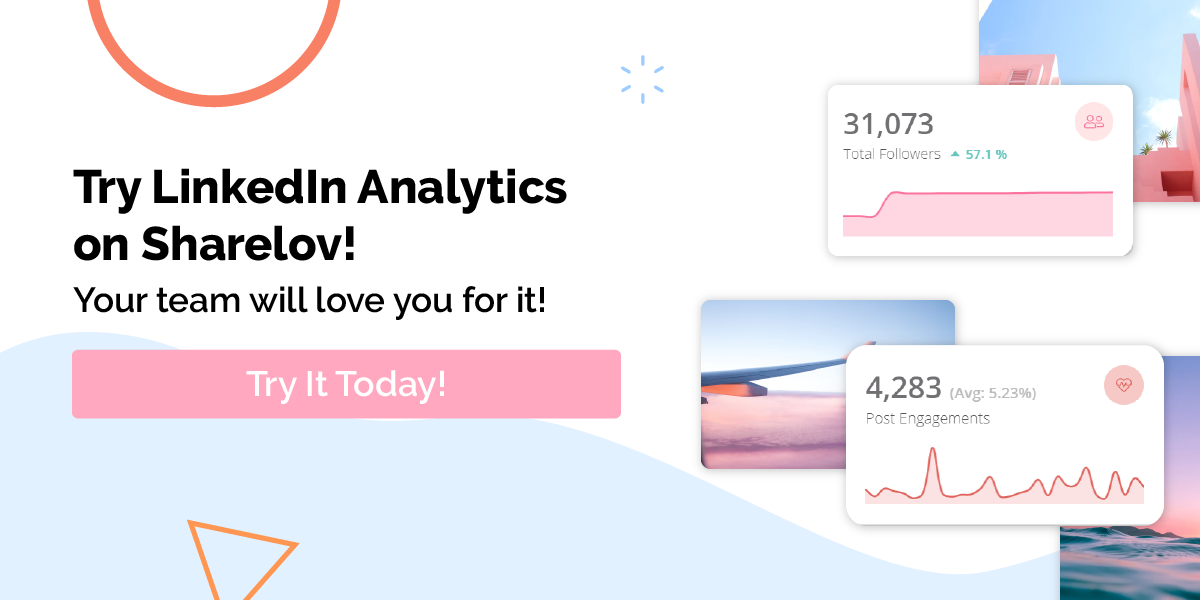
Sharelov Analytics for LinkedIn delivers all your most-important LinkedIn Page metrics from within your Sharelov dashboard.
With Sharelov, a quick click is all it takes to view your LinkedIn insights in a user-friendly format that’s easy to read.
When you’re working with a team of people, whether from home or across the office, Sharelov helps you collaborate more easily with user-friendly tools and features (such as LinkedIn Analytics) that elevate your social media marketing.
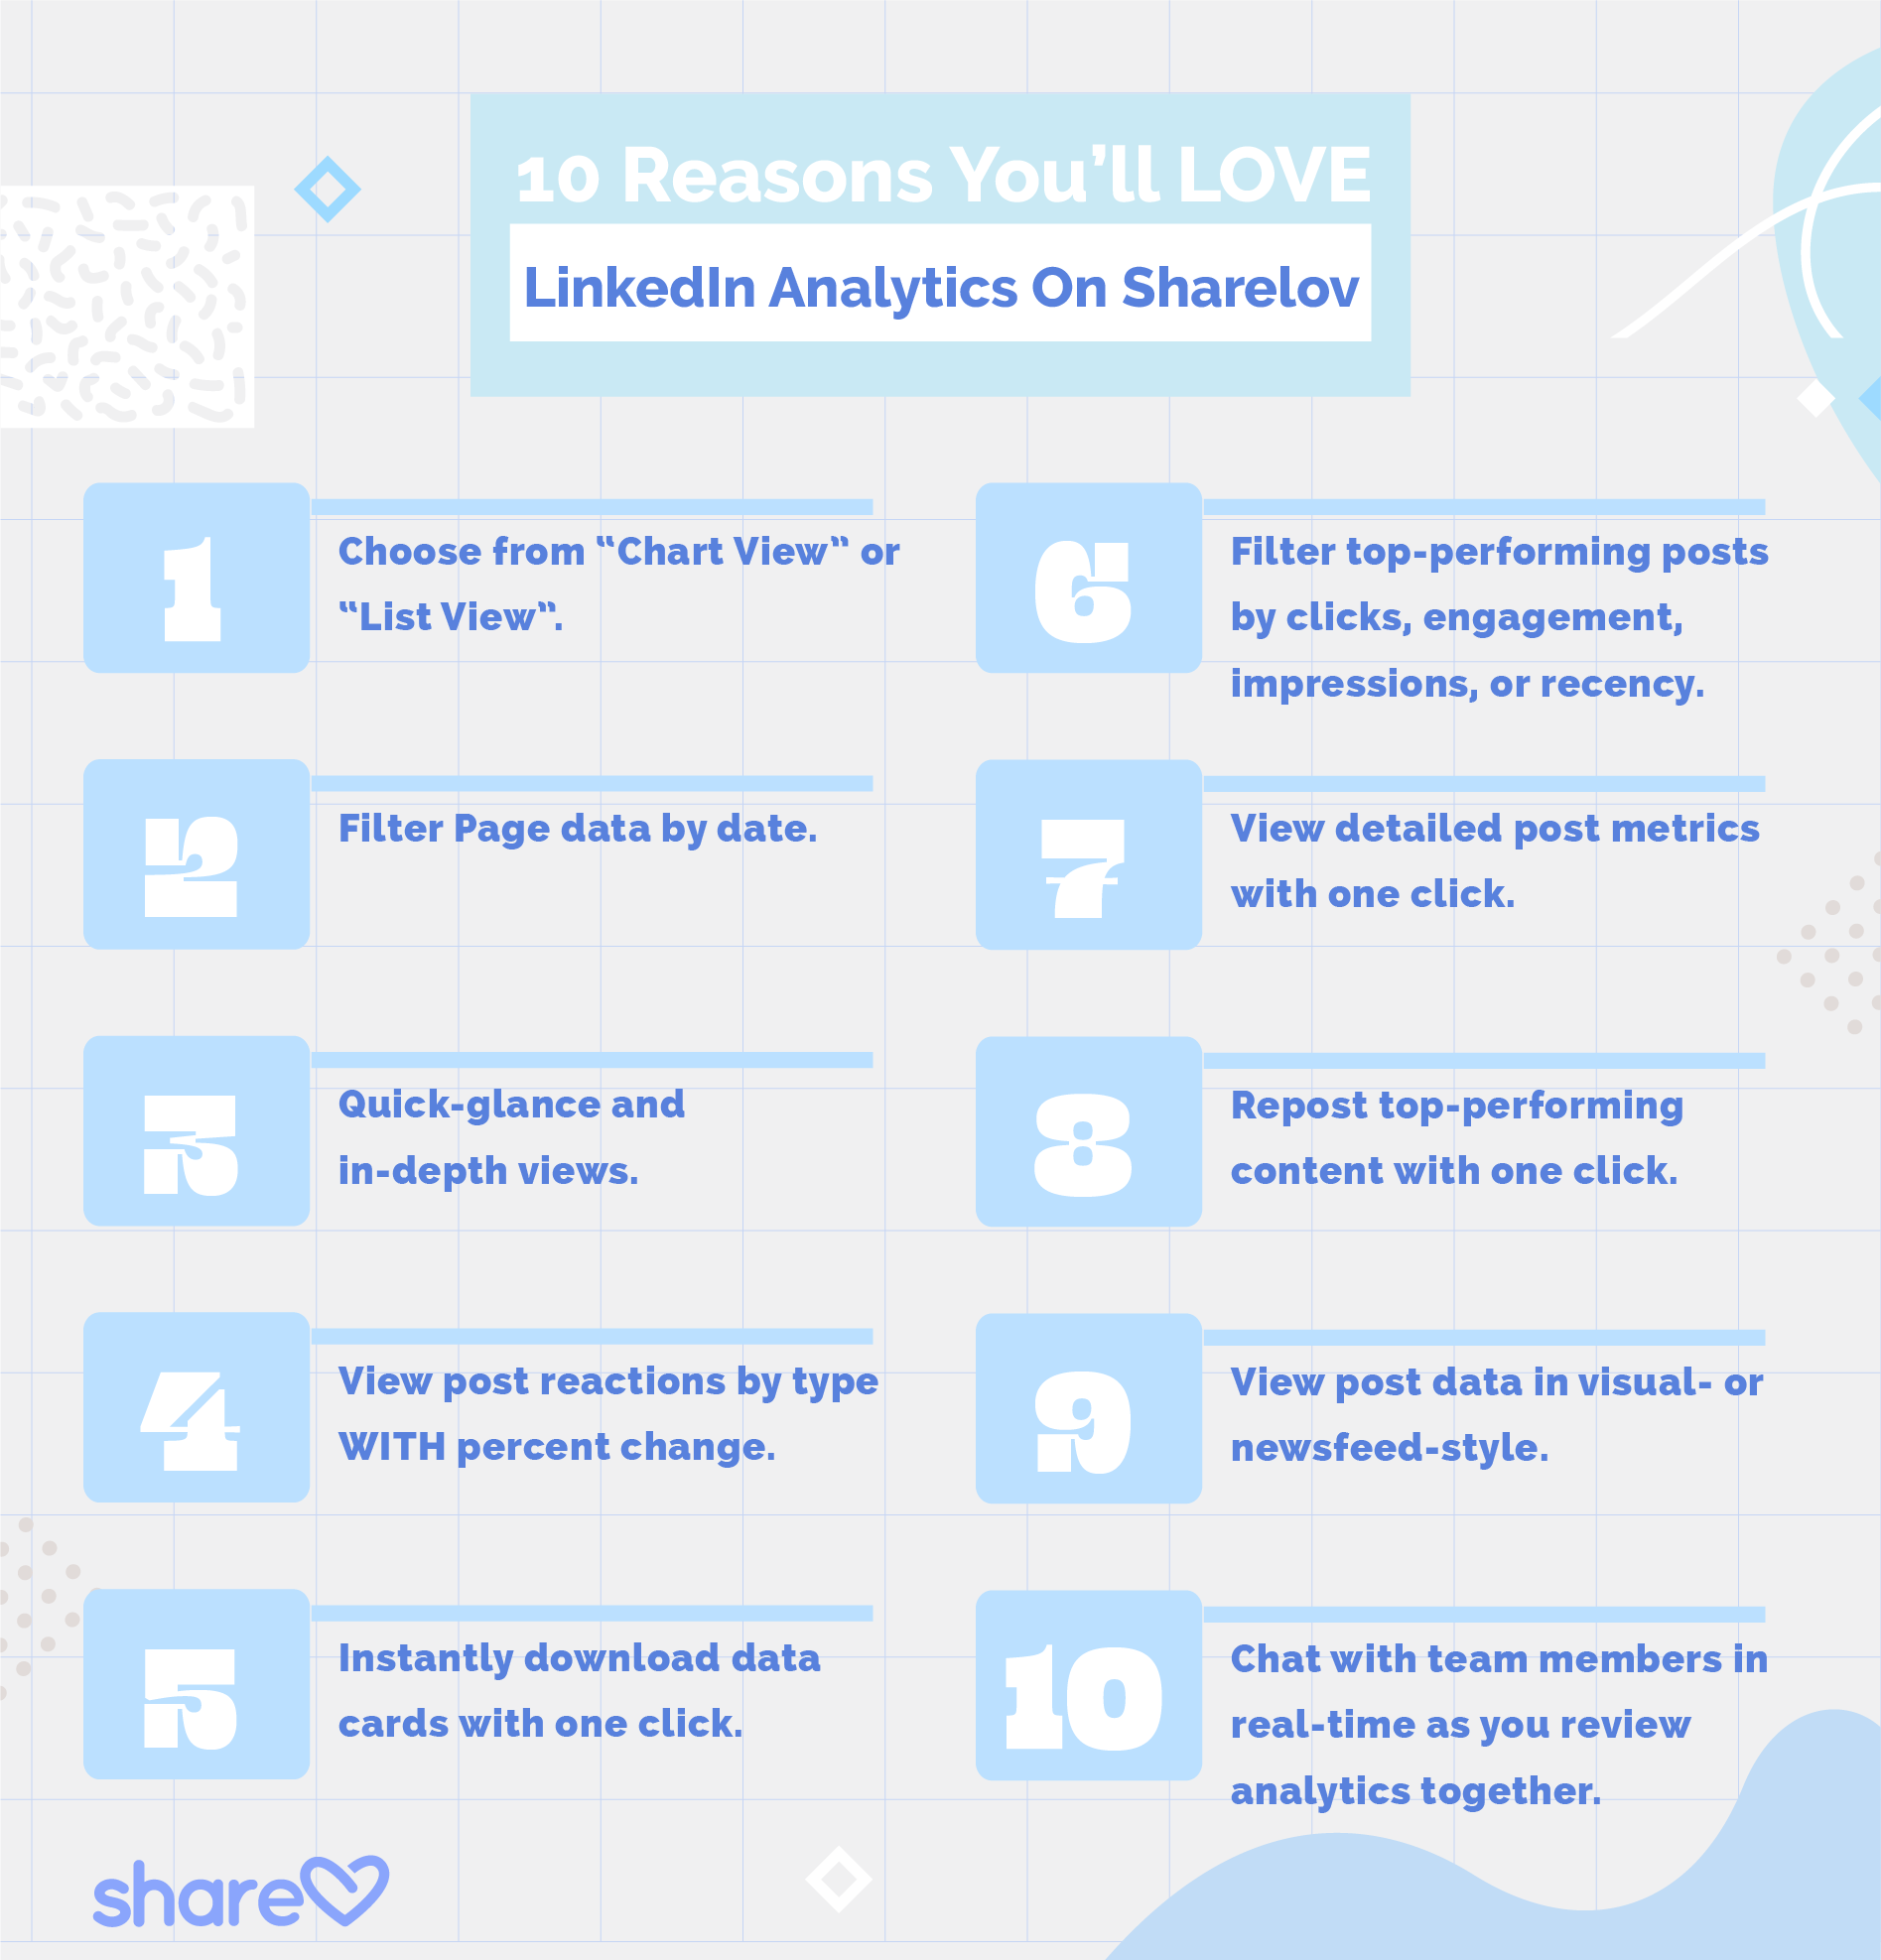
10 Reasons You’ll Love LinkedIn Analytics On Sharelov
With Sharelov, you can view your most important analytics data in just one or two clicks. Your team will thank you for the simple user-friendly interface that makes analytics so much easier!.
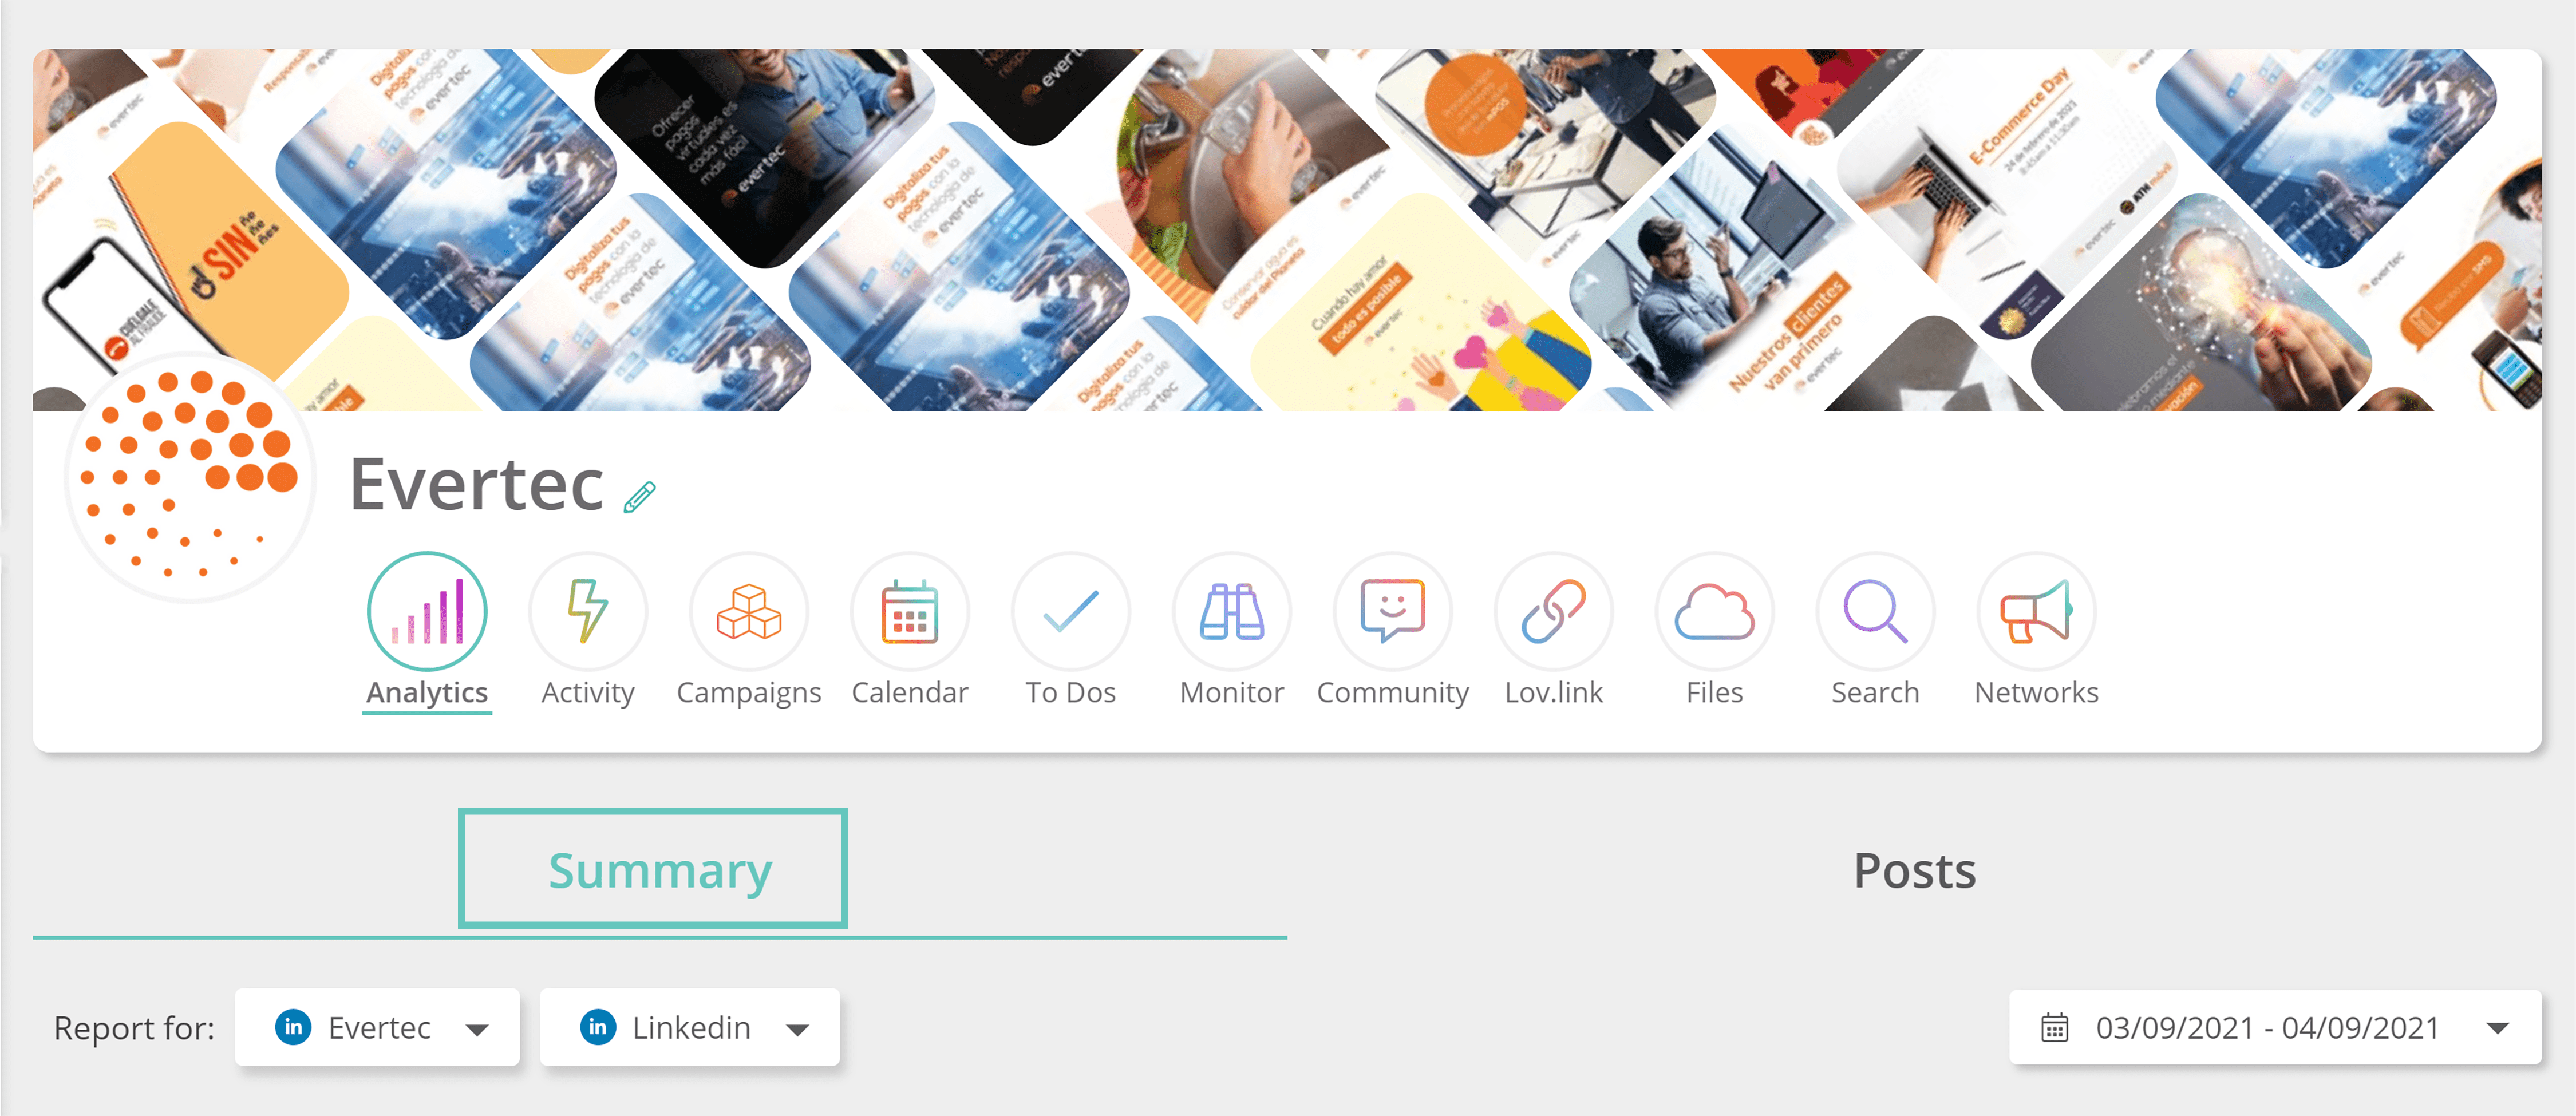
If you’re already a Sharelov subscriber, you can navigate to your LinkedIn Analytics dashboard by going to:
Brands (select brand) > Campaigns (select campaign) > Analytics > choose LinkedIn from the dropdown box.
If you’re not a Sharelov subscriber, give it a try for FREE right now.
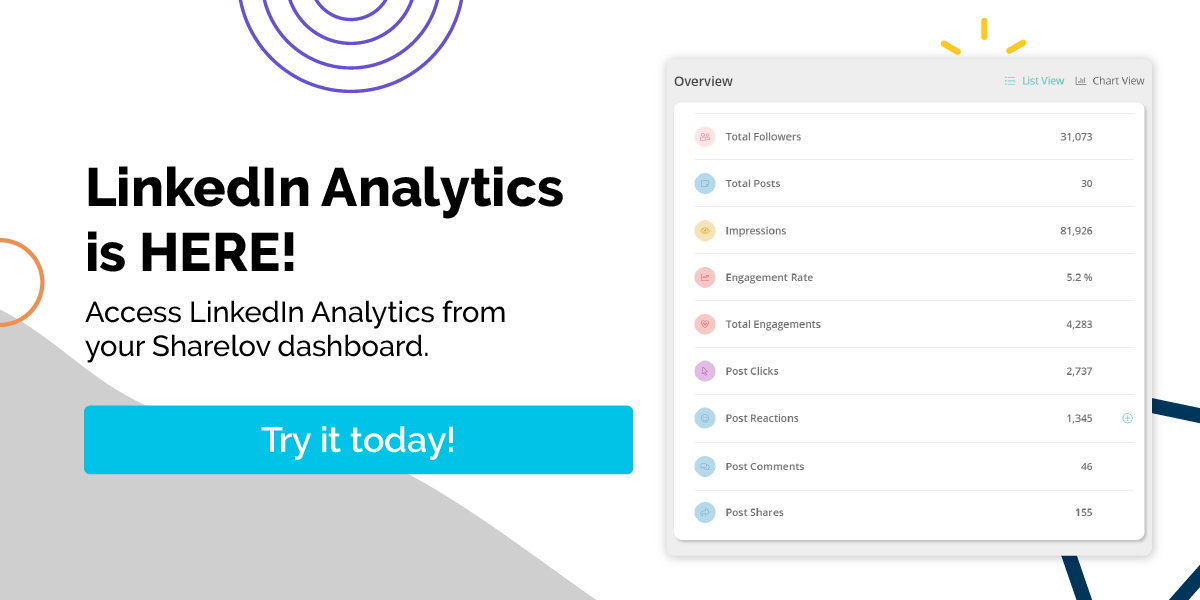
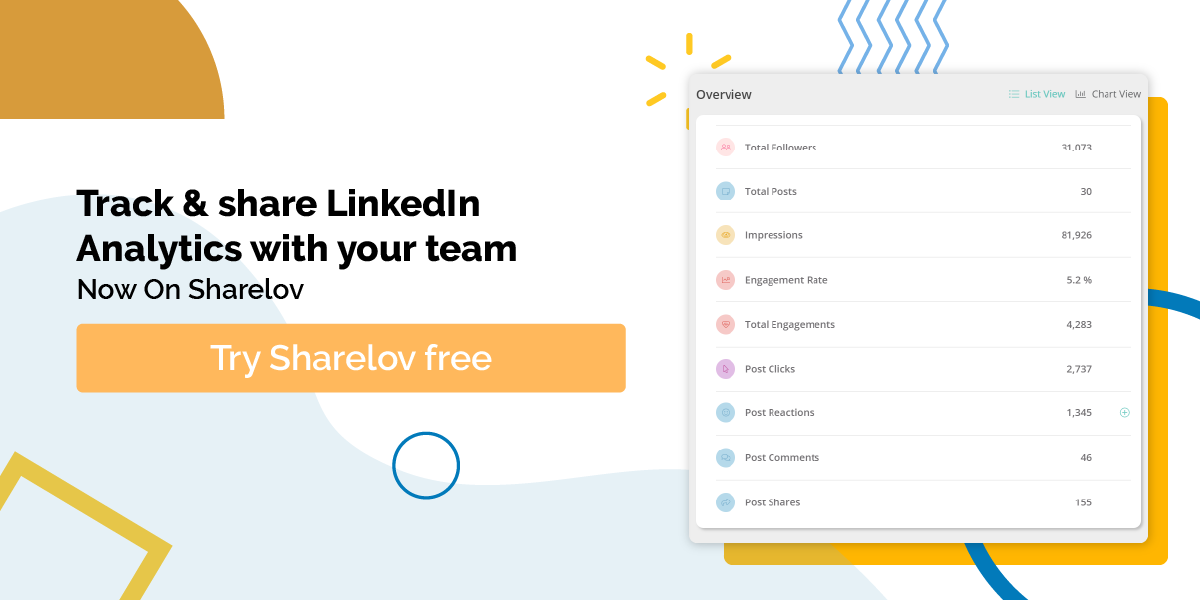
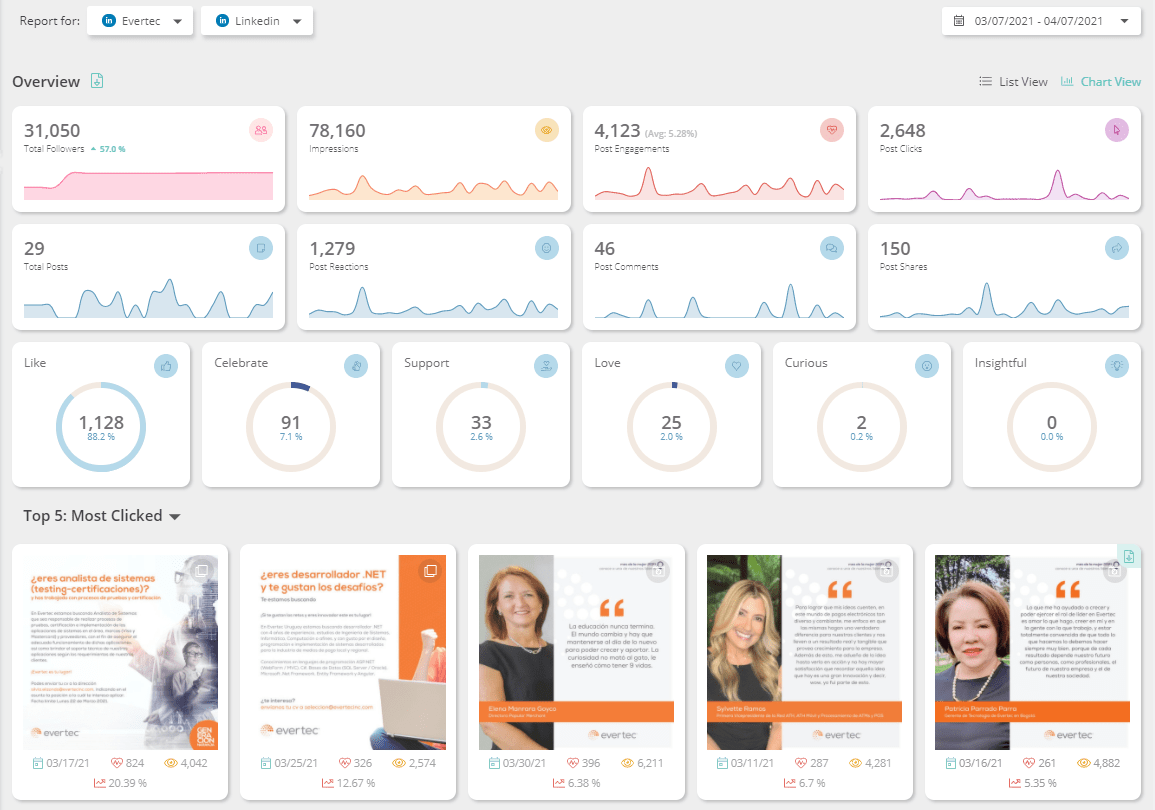
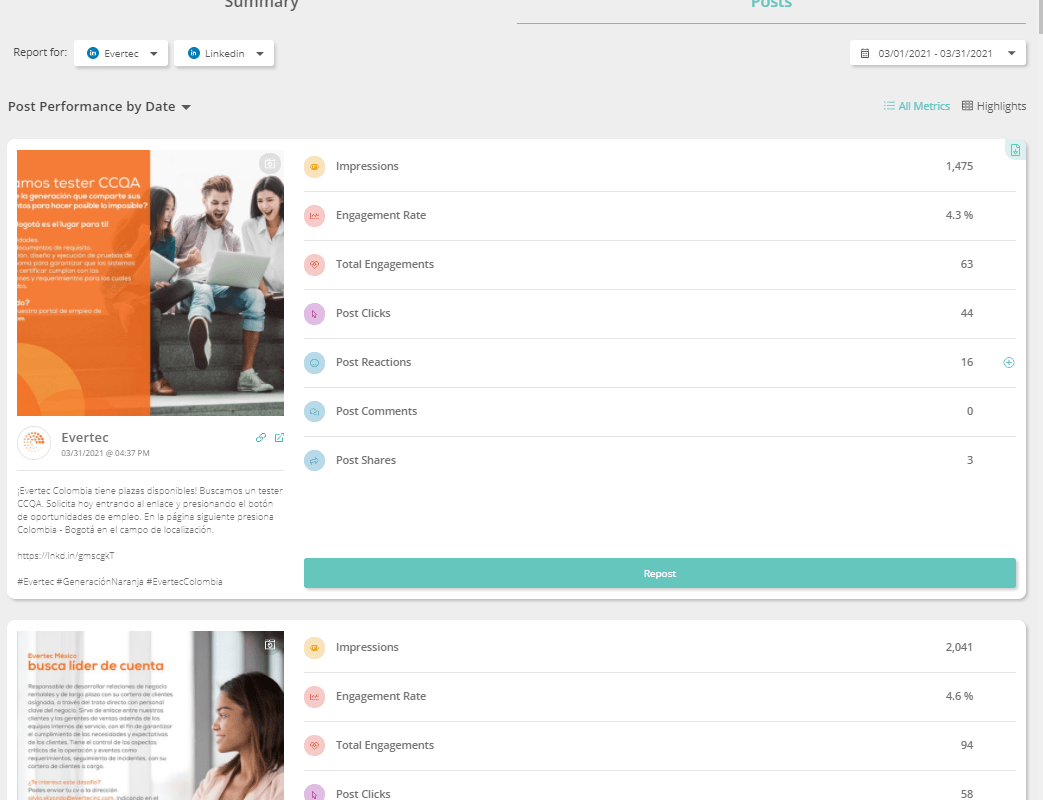
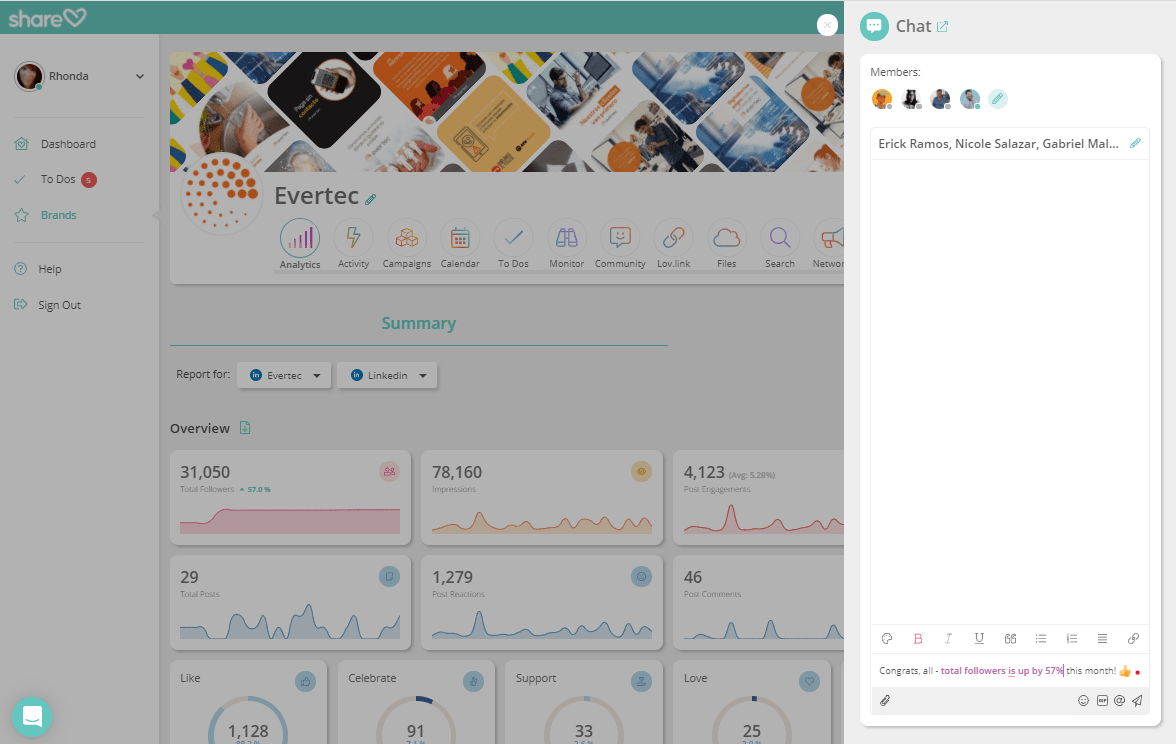
Once you’ve navigated to LinkedIn Analytics on Sharelov, you’ll be looking at a Summary View which provides a snapshot, or “overview,” of your Page and post performances.
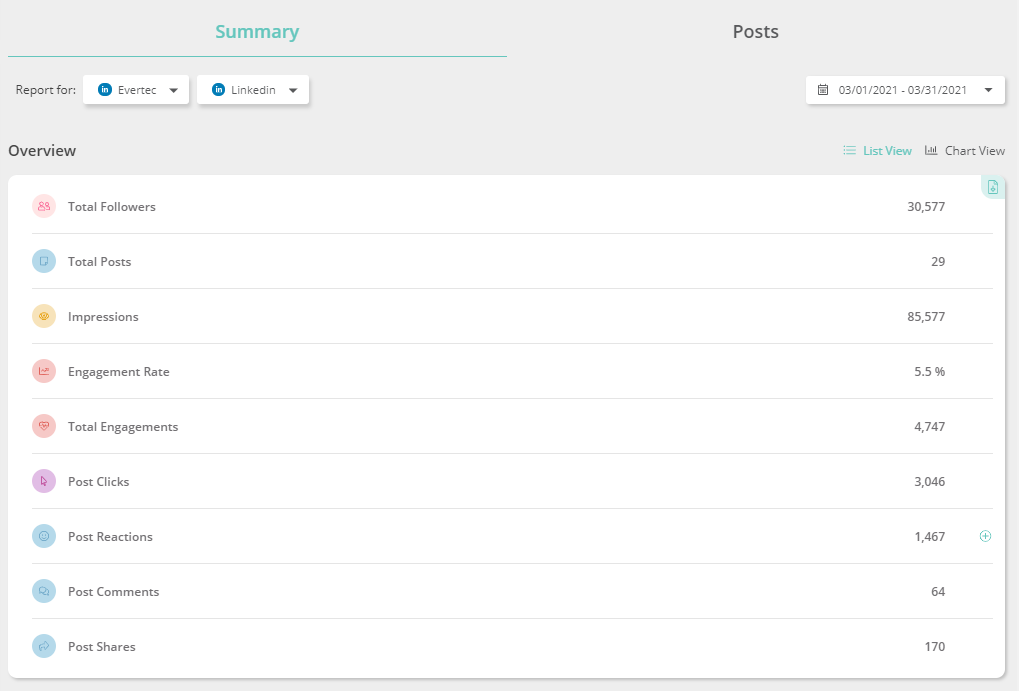
You’ll know you’re in Summary View because the “Summary” tab text is colored (see screenshot below). Alternatively, if you click on the “Posts” tab, then the summary tab will turn gray.
- You can choose “List View” or “Chart View” using the icons at the top on the right of this page.
Sharelov LinkedIn Analytics Chart view v. List view
For the purposes of this walkthrough, we’ll use the chart view, which provides visual navigation.
2. You can filter your page metrics (top rows) by date using the dropdown calendar on the right.

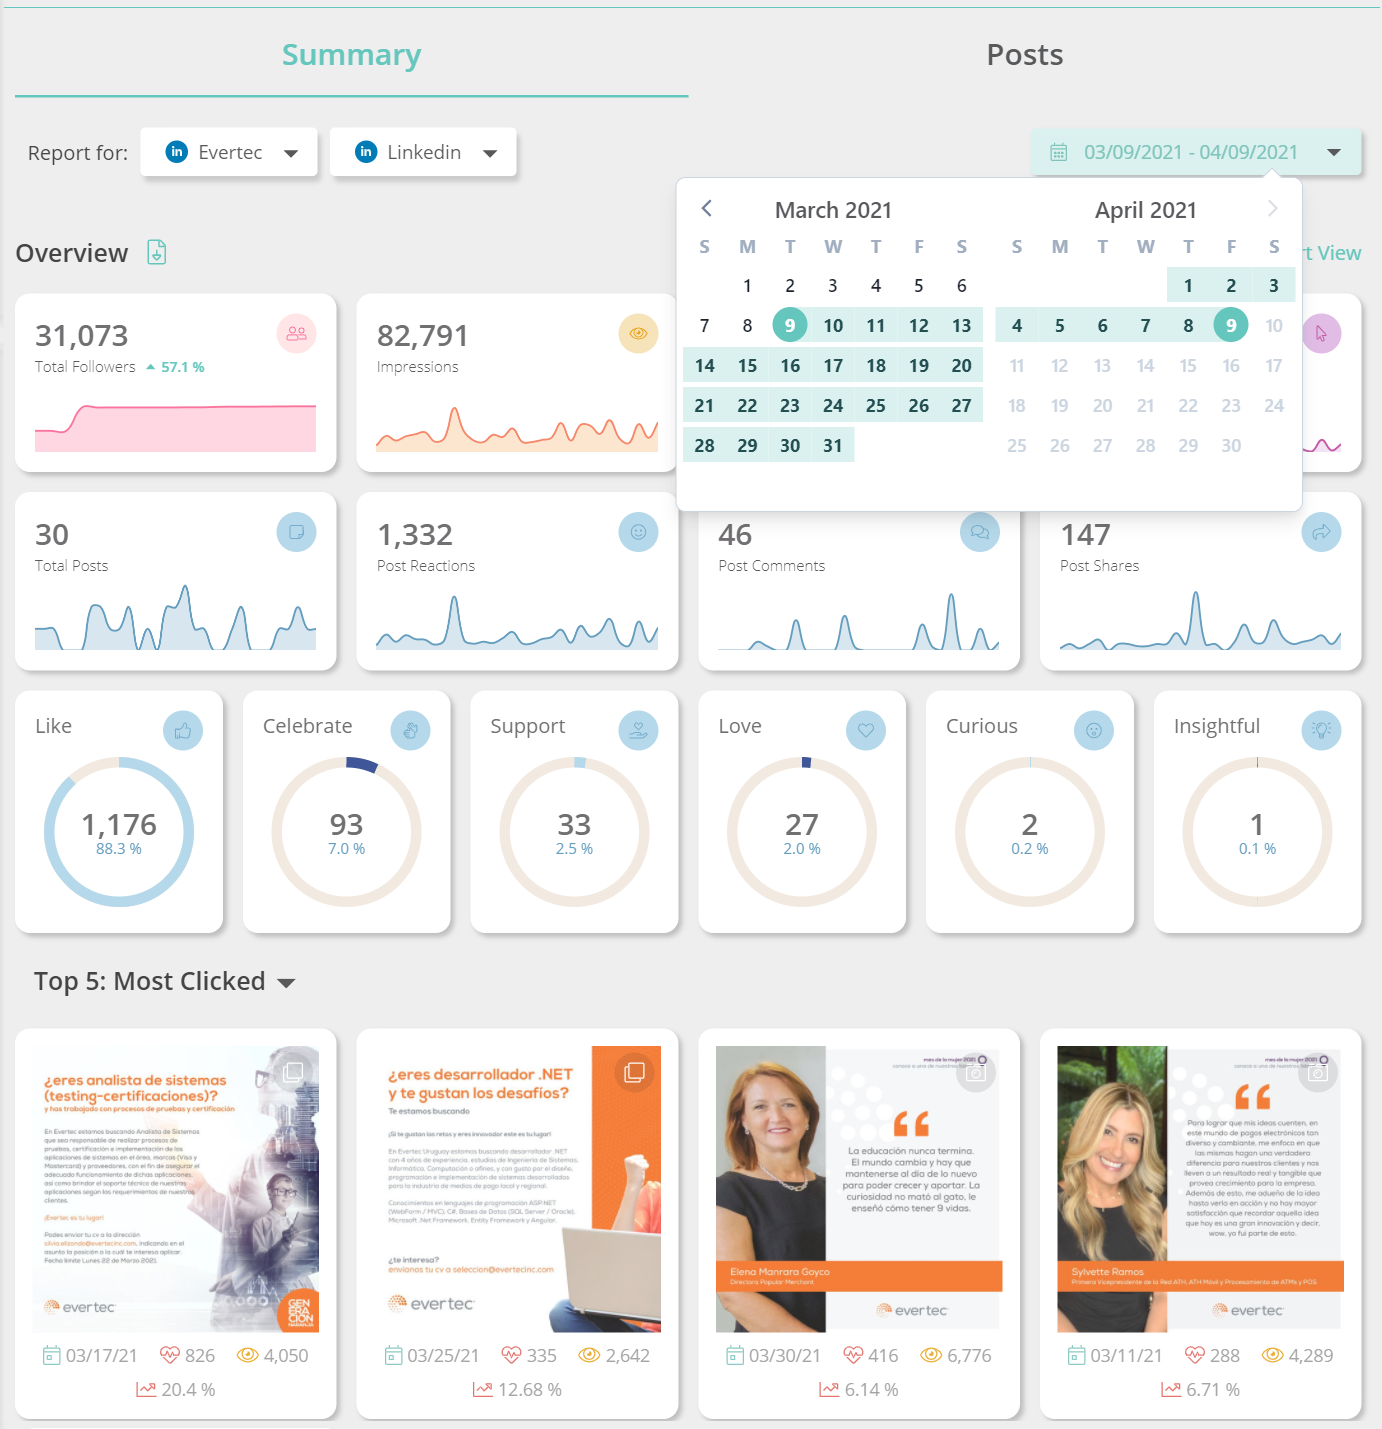
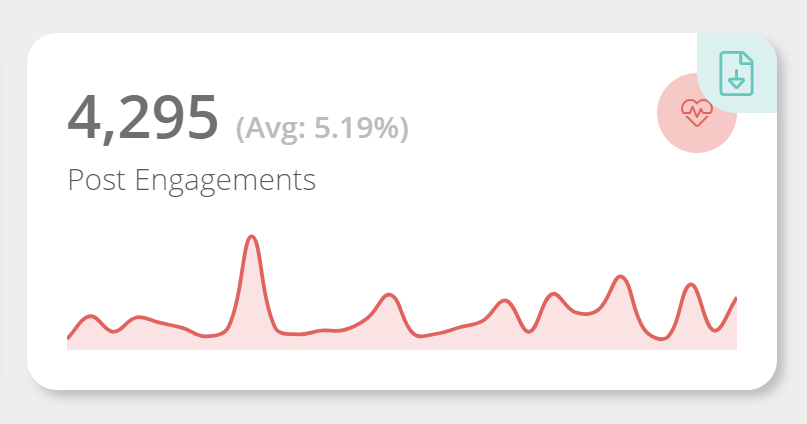
3. While in Chart View, you get a quick glance at some of your most important metrics, including:
- Total followers + percent change from previous time period, up or down
- Impressions
- Total post engagements + engagement rate
- Total post clicks
- Total number of posts
- Total post reactions
- Total post comments
- Total post shares
4. You can view a breakdown of your post reactions by scrolling down to the circle graphs, which show you the:
- Total “Like” reactions + percent change from previous month
- Total “Celebrate” reactions + percent change from previous month, up or down
- Total “Support” reactions + percent change from previous month
- Total “Love” reactions + percent change from previous month
- Total “Curious” reactions + percent change from previous month
- Total “Insightful” reactions + percent change from previous month
5. Sharelov’s friendly user interface lets you download any data card by scrolling over it and clicking on the download icon that appears in its right-hand corner.
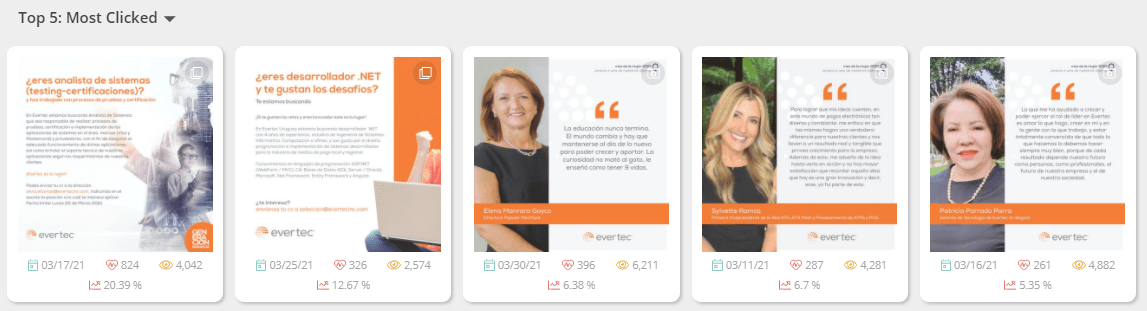
6. Below your page metrics (still in Summary>chart view), you’ll find your top 5 performing posts, which you can filter by most clicked, most engaging, most impressions, or most recent.
7. You can pull up detailed post metrics by simply clicking on a post. Detailed post metrics show you statistics related to your posts:
- Impressions
- Engagement rate
- Total engagements
- Post clicks
- Post reactions
- Post comments
- Post shares
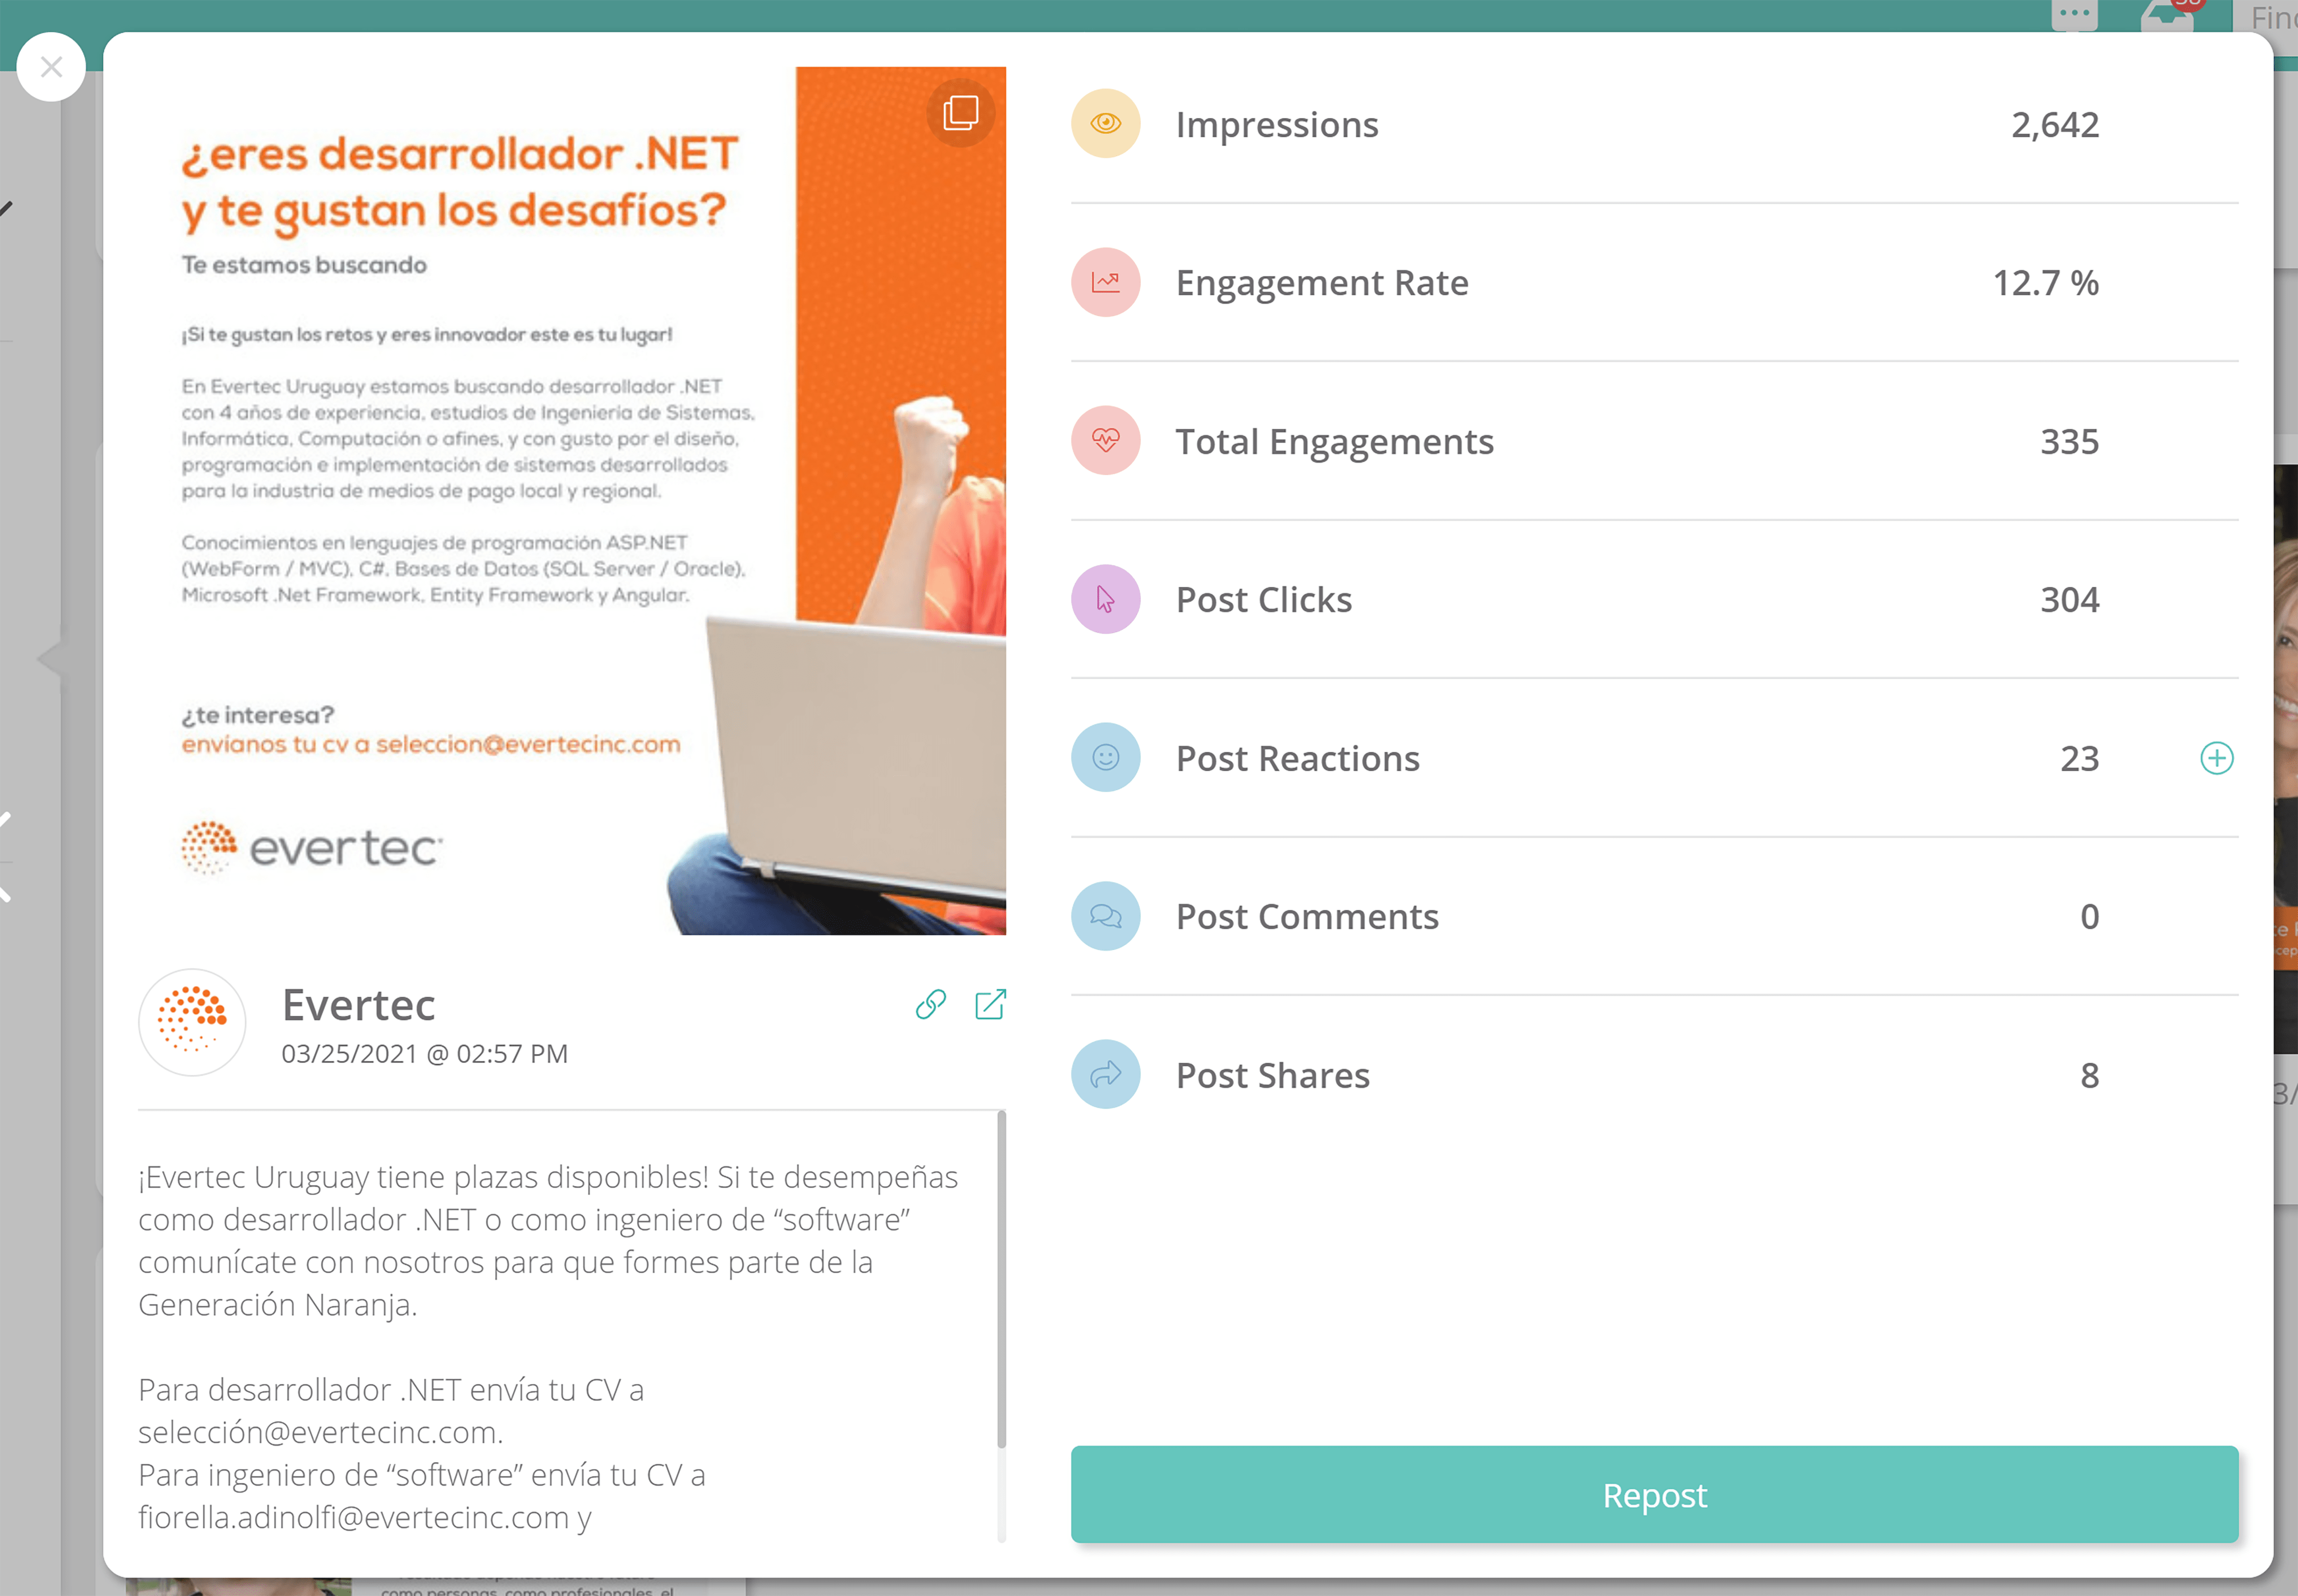
8. Each of the post data cards provides two functions:
- Download the data card by scrolling over it and clicking on the download icon that appears in the upper-right corner.
- Repost button — so you can easily repost your top-performing LinkedIn updates!
9. You can also view your post data in a newsfeed-type format that allows you to scroll post data cards. Just switch over to the “Posts” tab to easily scroll your post data cards!
10. Get on the “same page” (literally!) with your team and review your page and post statistics together!
Sharelov’s chat function lets you chat with team members instantly from nearly any page.
Sharelov’s LinkedIn Analytics makes it soooo much easier and quicker to access and review your updates (“post”) and Page Analytics.
Your team will thank you for making their jobs easier, and they’ll be able to spend more time creating new ideas to move your brand forward!
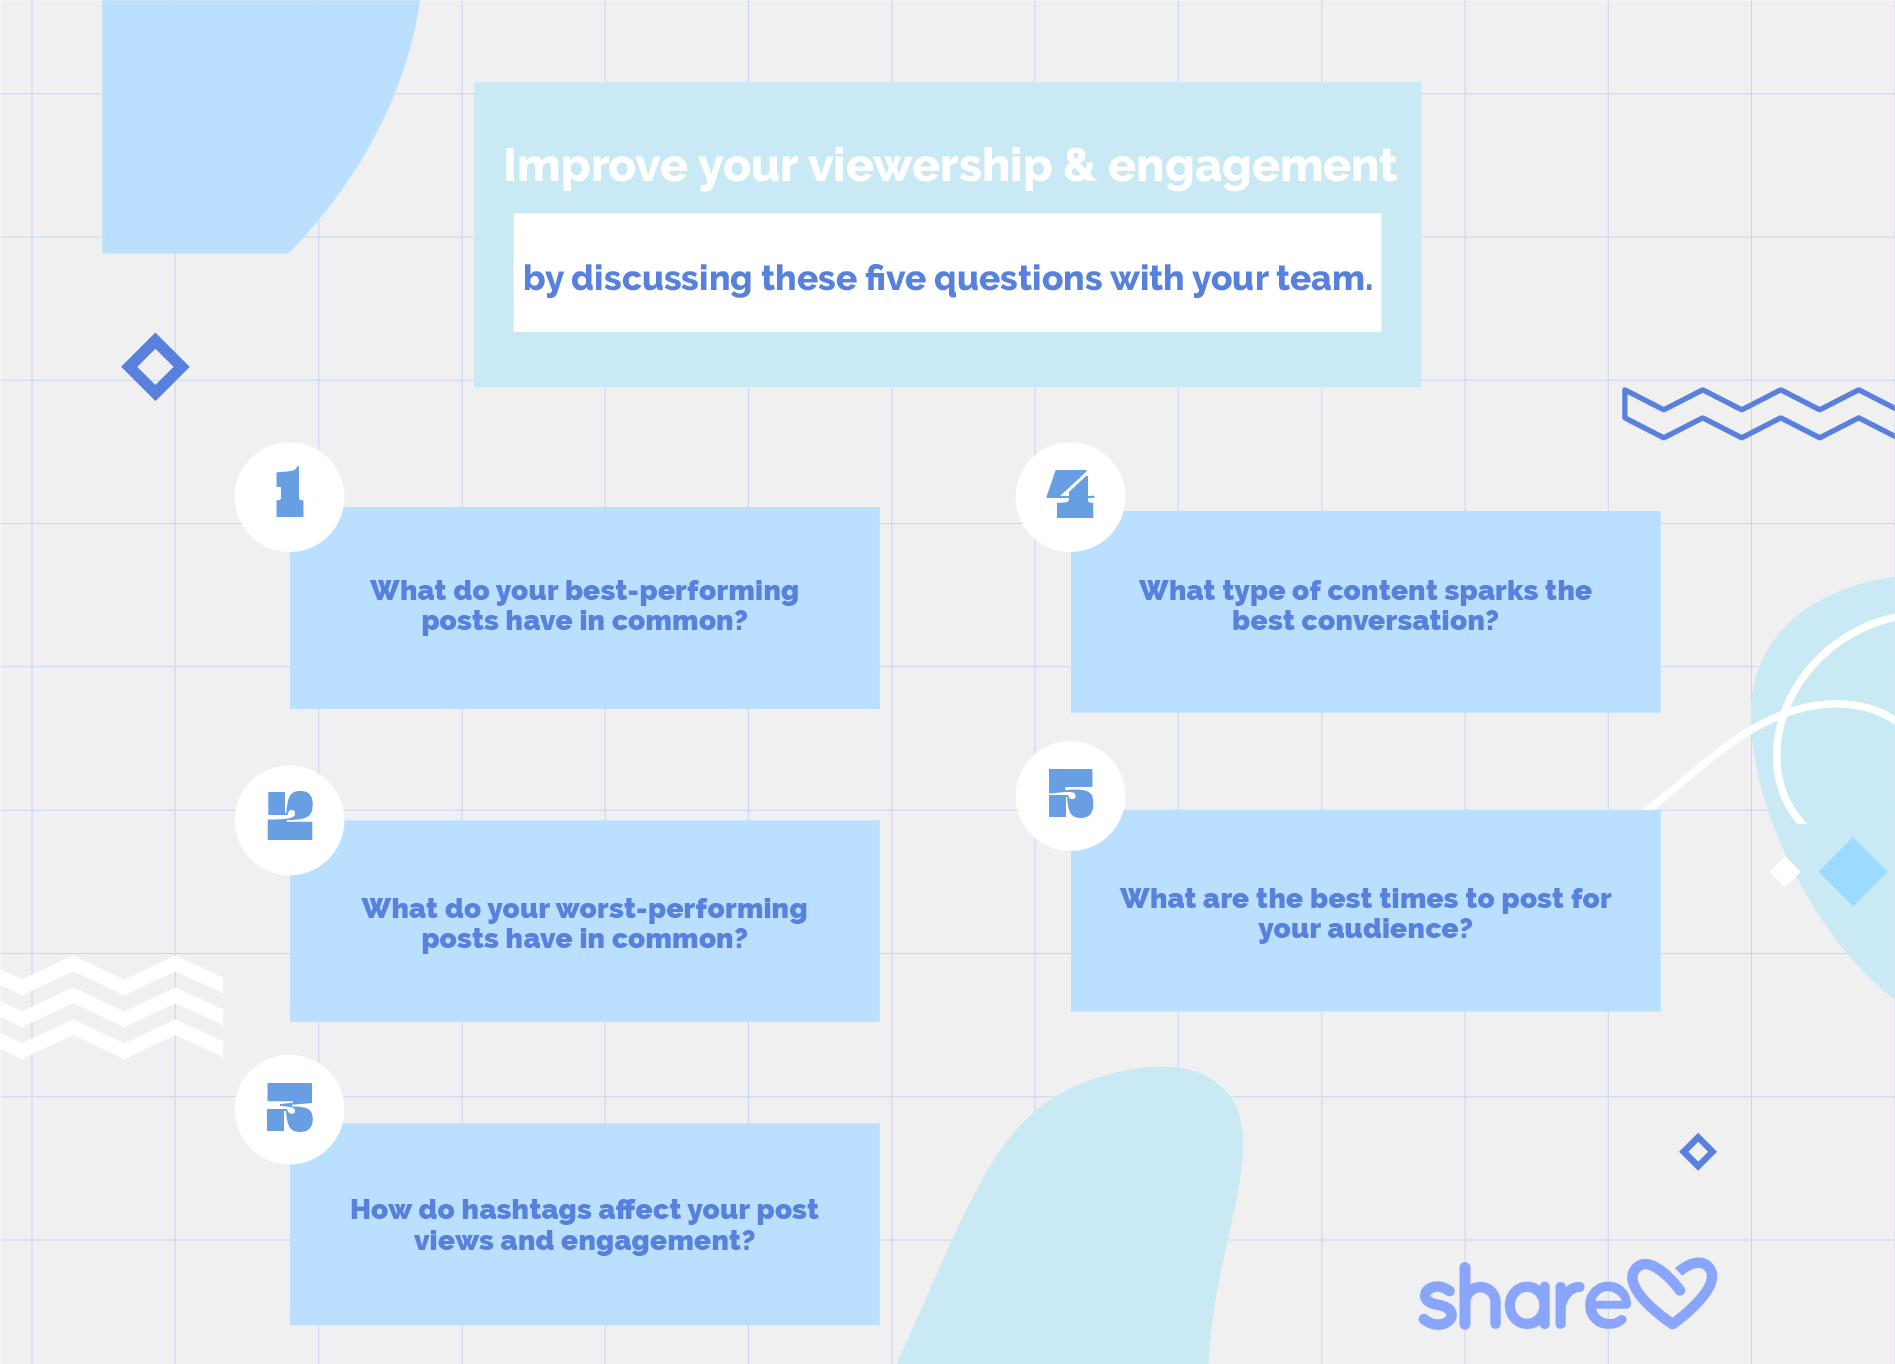
Building A Path To Success With Linkedin Analytics
The data within your LinkedIn Analytics reveals important clues about how to expand your viewership and engagement.
Use your metrics and Sharelov charts to discover answers to questions such as:
- What do your best-performing posts have in common?
- What do your worst-performing posts have in common?
- How do hashtags affect your post views and engagement?
- What type of content sparks the best conversation?
- What are the best times to post for your audience?
- What posts do the best job of reaching your target audience?
Over time you can boost the results of any marketing objective by creating more of the type of content that’s getting the best results.
LinkedIn Analytics For Professionals
LinkedIn is a massive gathering place for professionals who are serious about improving their careers and building their businesses.
Businesses love marketing on LinkedIn because they know that a high percent of users are decision-makers within their companies, and people come to the platform serious about doing business.
LinkedIn Analytics provides your company with comprehensive statistics that show you how well your Page and its updates (posts) are performing.
By reviewing your analytics regularly, you can determine how your content, publishing, relationships, and advertising is helping (or not helping) you to succeed on the platform.