Credible Instagram statistics for 2019 that your team can use for content marketing, social media, and campaign planning
Bookmark this article now, and you won’t have to spend any more time searching for Instagram statistics in 2019.
Tracking down current, accurate stats for your articles, social media posts, and marketing strategies can eat up a ton of your valuable time.
Now, you can put that energy into creating valuable content and writing better marketing plans instead.
Because we did the research for you.
We’ve scoured dozens of Instagram reports and white papers to uncover the most credible statistics available in 2019.
They’re organized for quick searching, and every piece of data is linked to its proper source.
Who’s using Instagram?
How do people use Instagram?
How are other brands using Instagram?
What leads to high engagement rates?
At some point this year, you’ll want answers to all these questions.
Bookmark this article or download the free PDF to save your most valuable resource – your time!
TIP: Subscribe to our email list to find out when new statistics are added!
Why Use Instagram for Business?
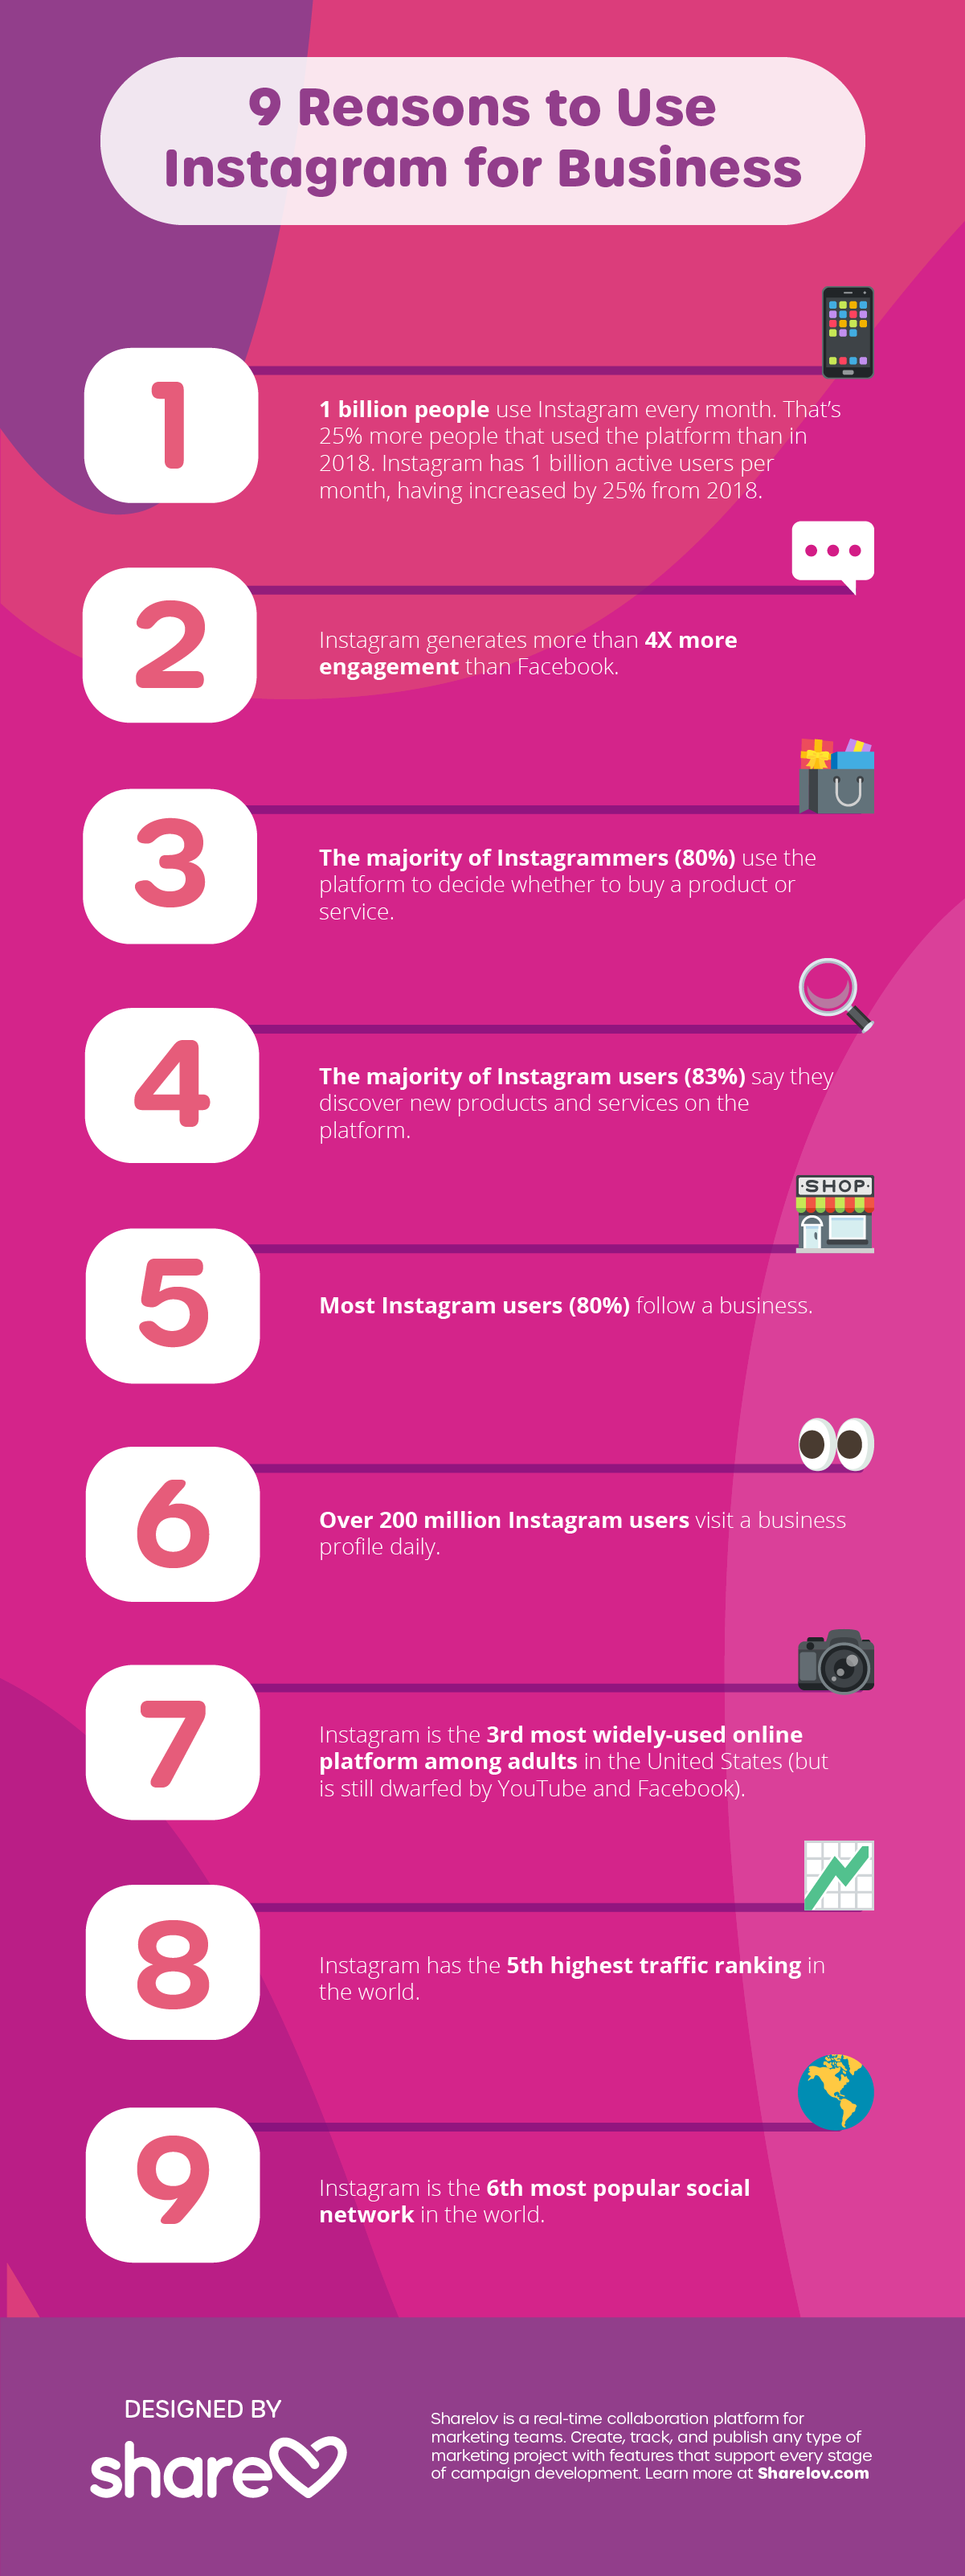
1. 500 million people use Instagram Stories every day.
2. Instagram generates more than 4X more engagement than Facebook.
3. The majority of Instagrammers (80%) use the platform to decide whether to buy a product or service.
4. The majority of Instagram users (83%) say they discover new products and services on the platform.
5. Most Instagram users (80%) follow a business.
6. Over 200 million Instagram users visit a business profile daily.
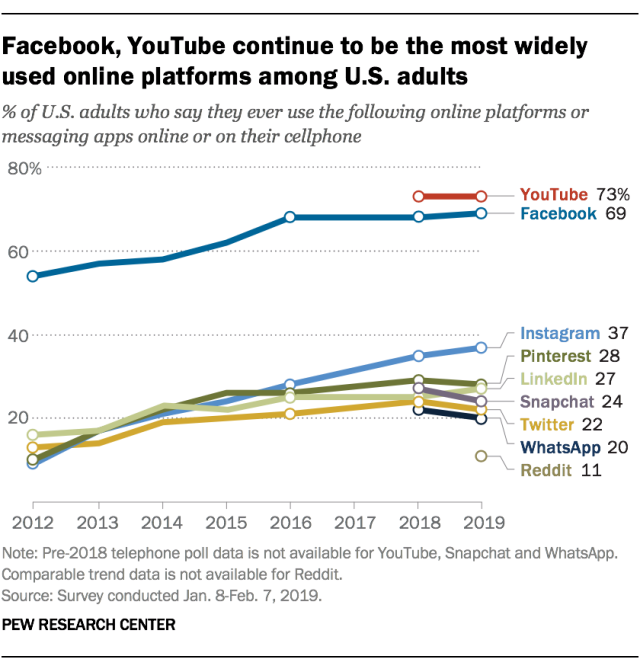
7. Instagram is the 3rd most widely-used online platform among adults in the United States (but is still dwarfed by YouTube and Facebook).
8. Instagram has the 5th highest traffic ranking in the world.
9. Instagram is the 6th most popular social network in the world.
9 Reasons to Use Instagram for Business
All About Instagram Users
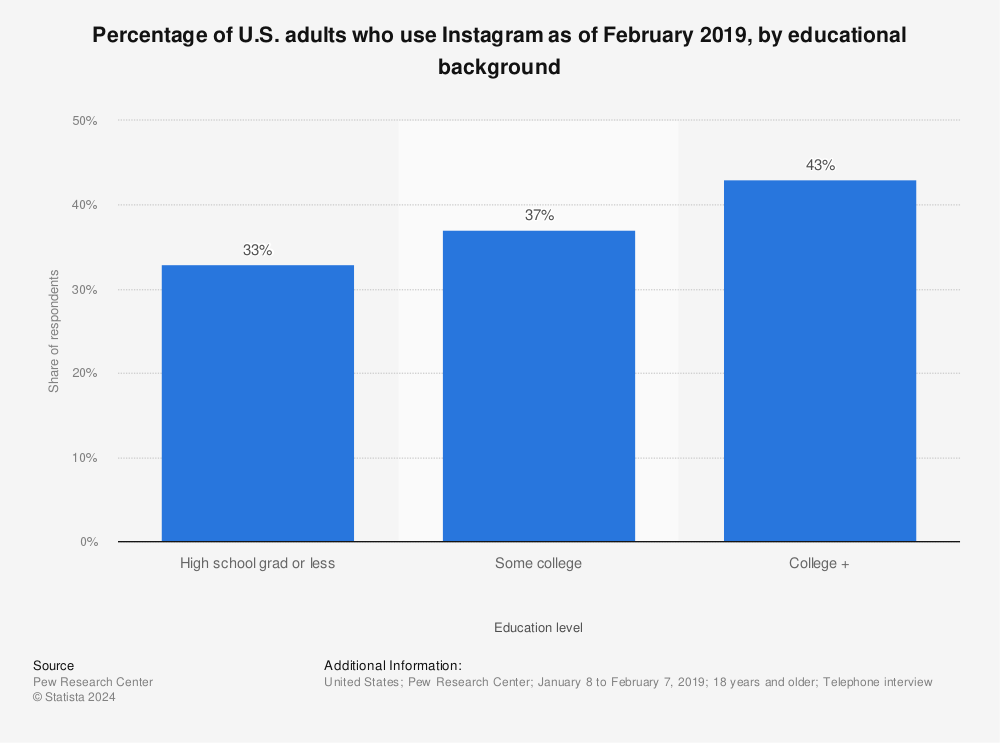
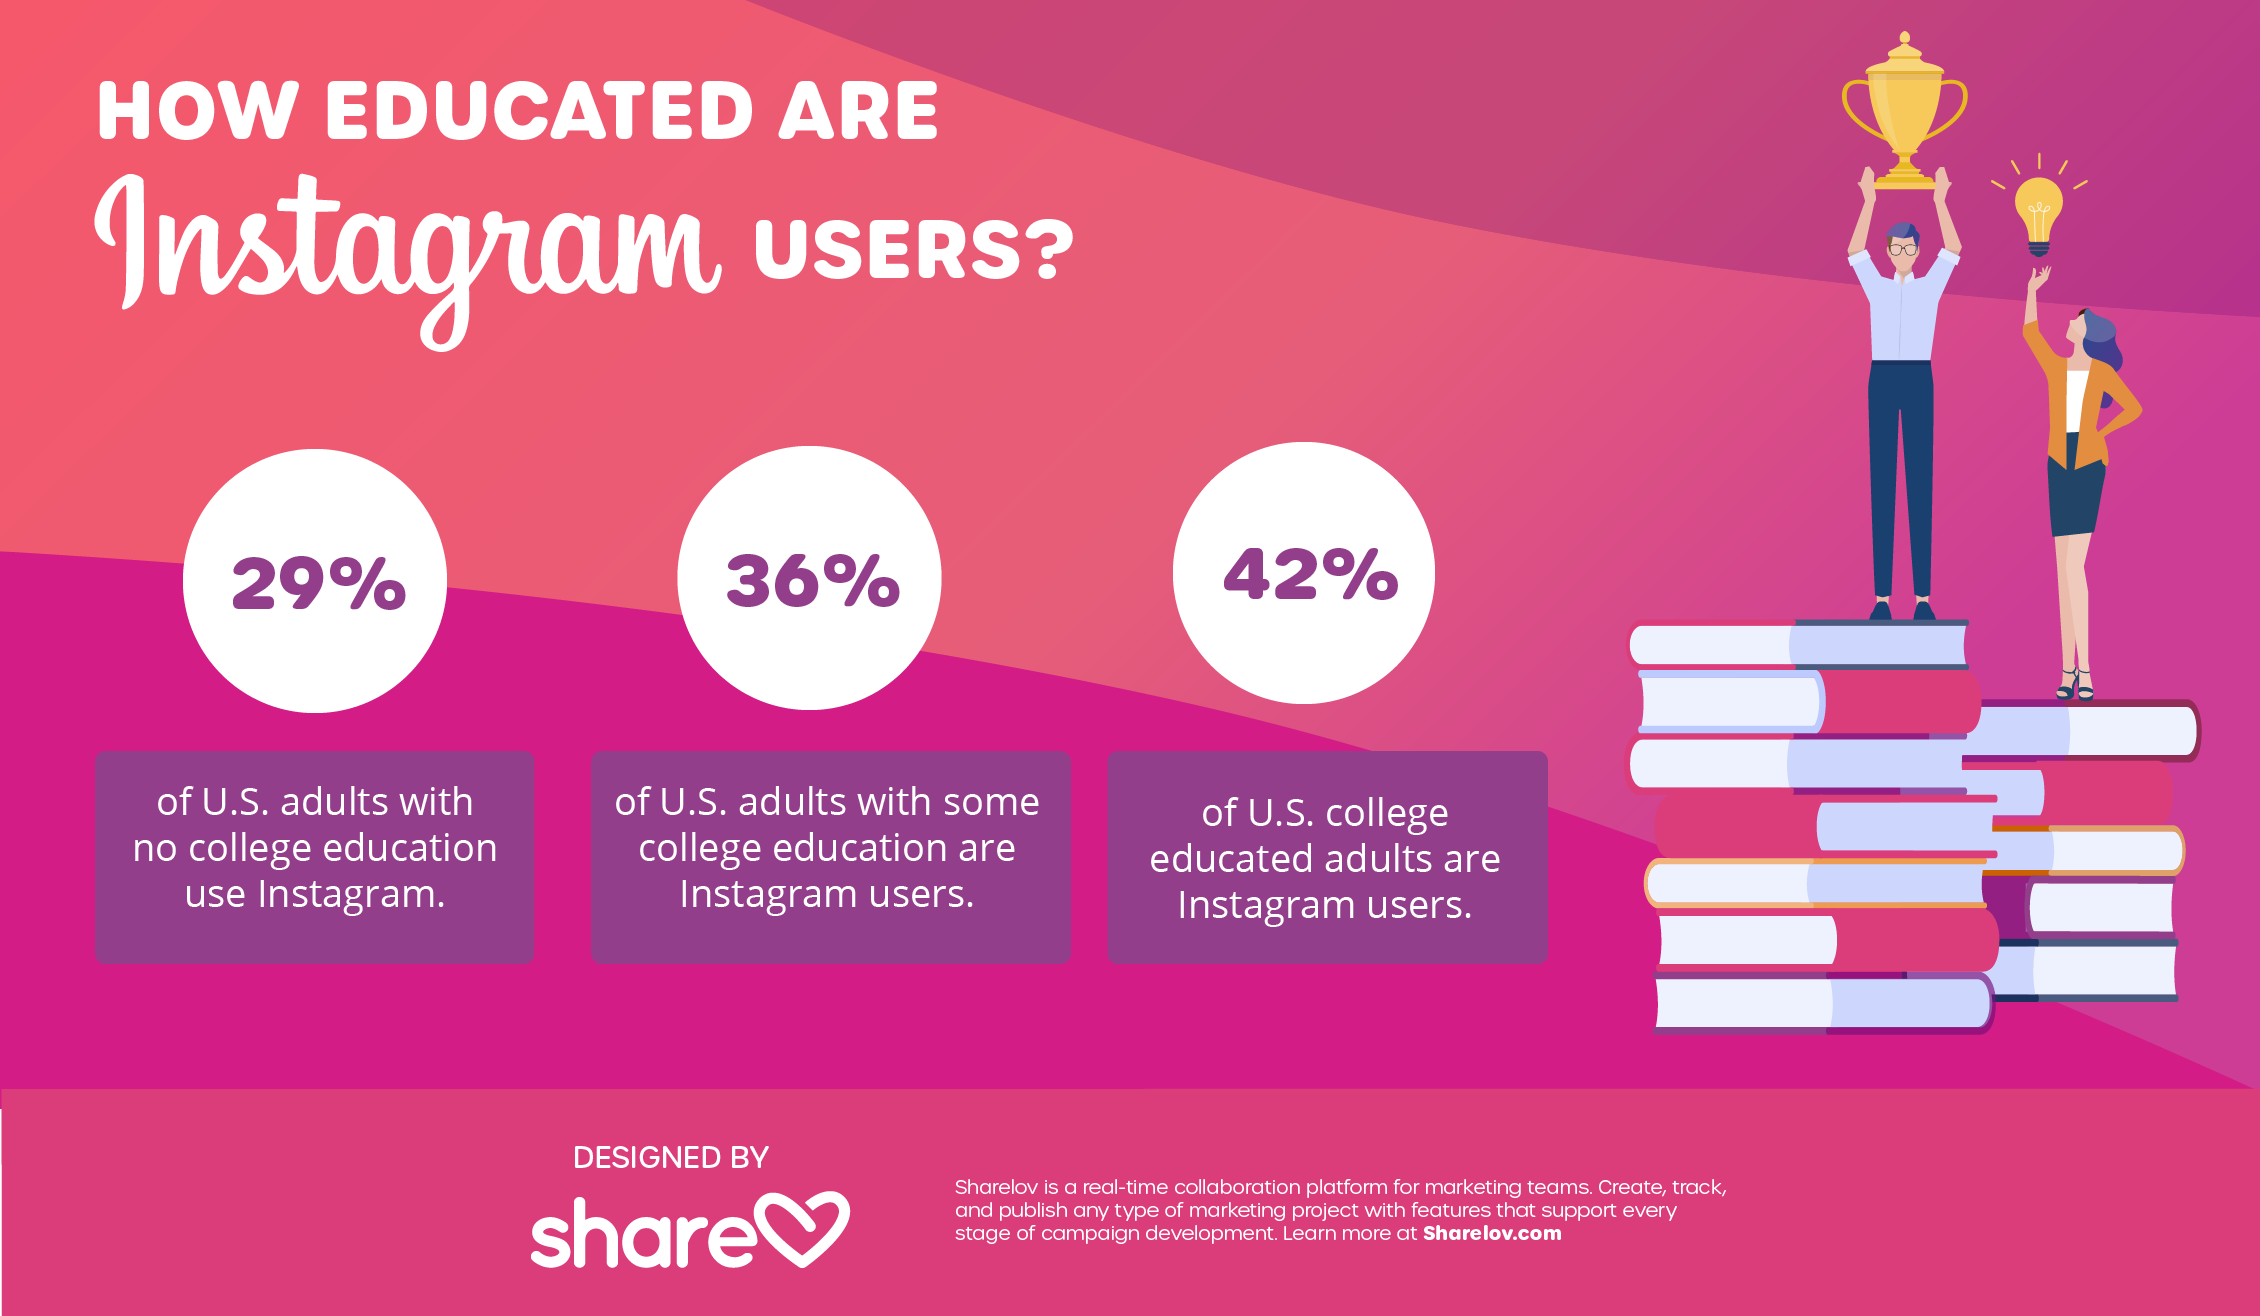
In the United States, the more educated a person is, the more likely they are to use Instagram.
10. 29% of U.S. adults with no college education use Instagram.
11. 36% of U.S. adults with some college education are Instagram users.
12. 42% of U.S. college educated adults in the U.S. are Instagram users.
People from all income brackets use Instagram.
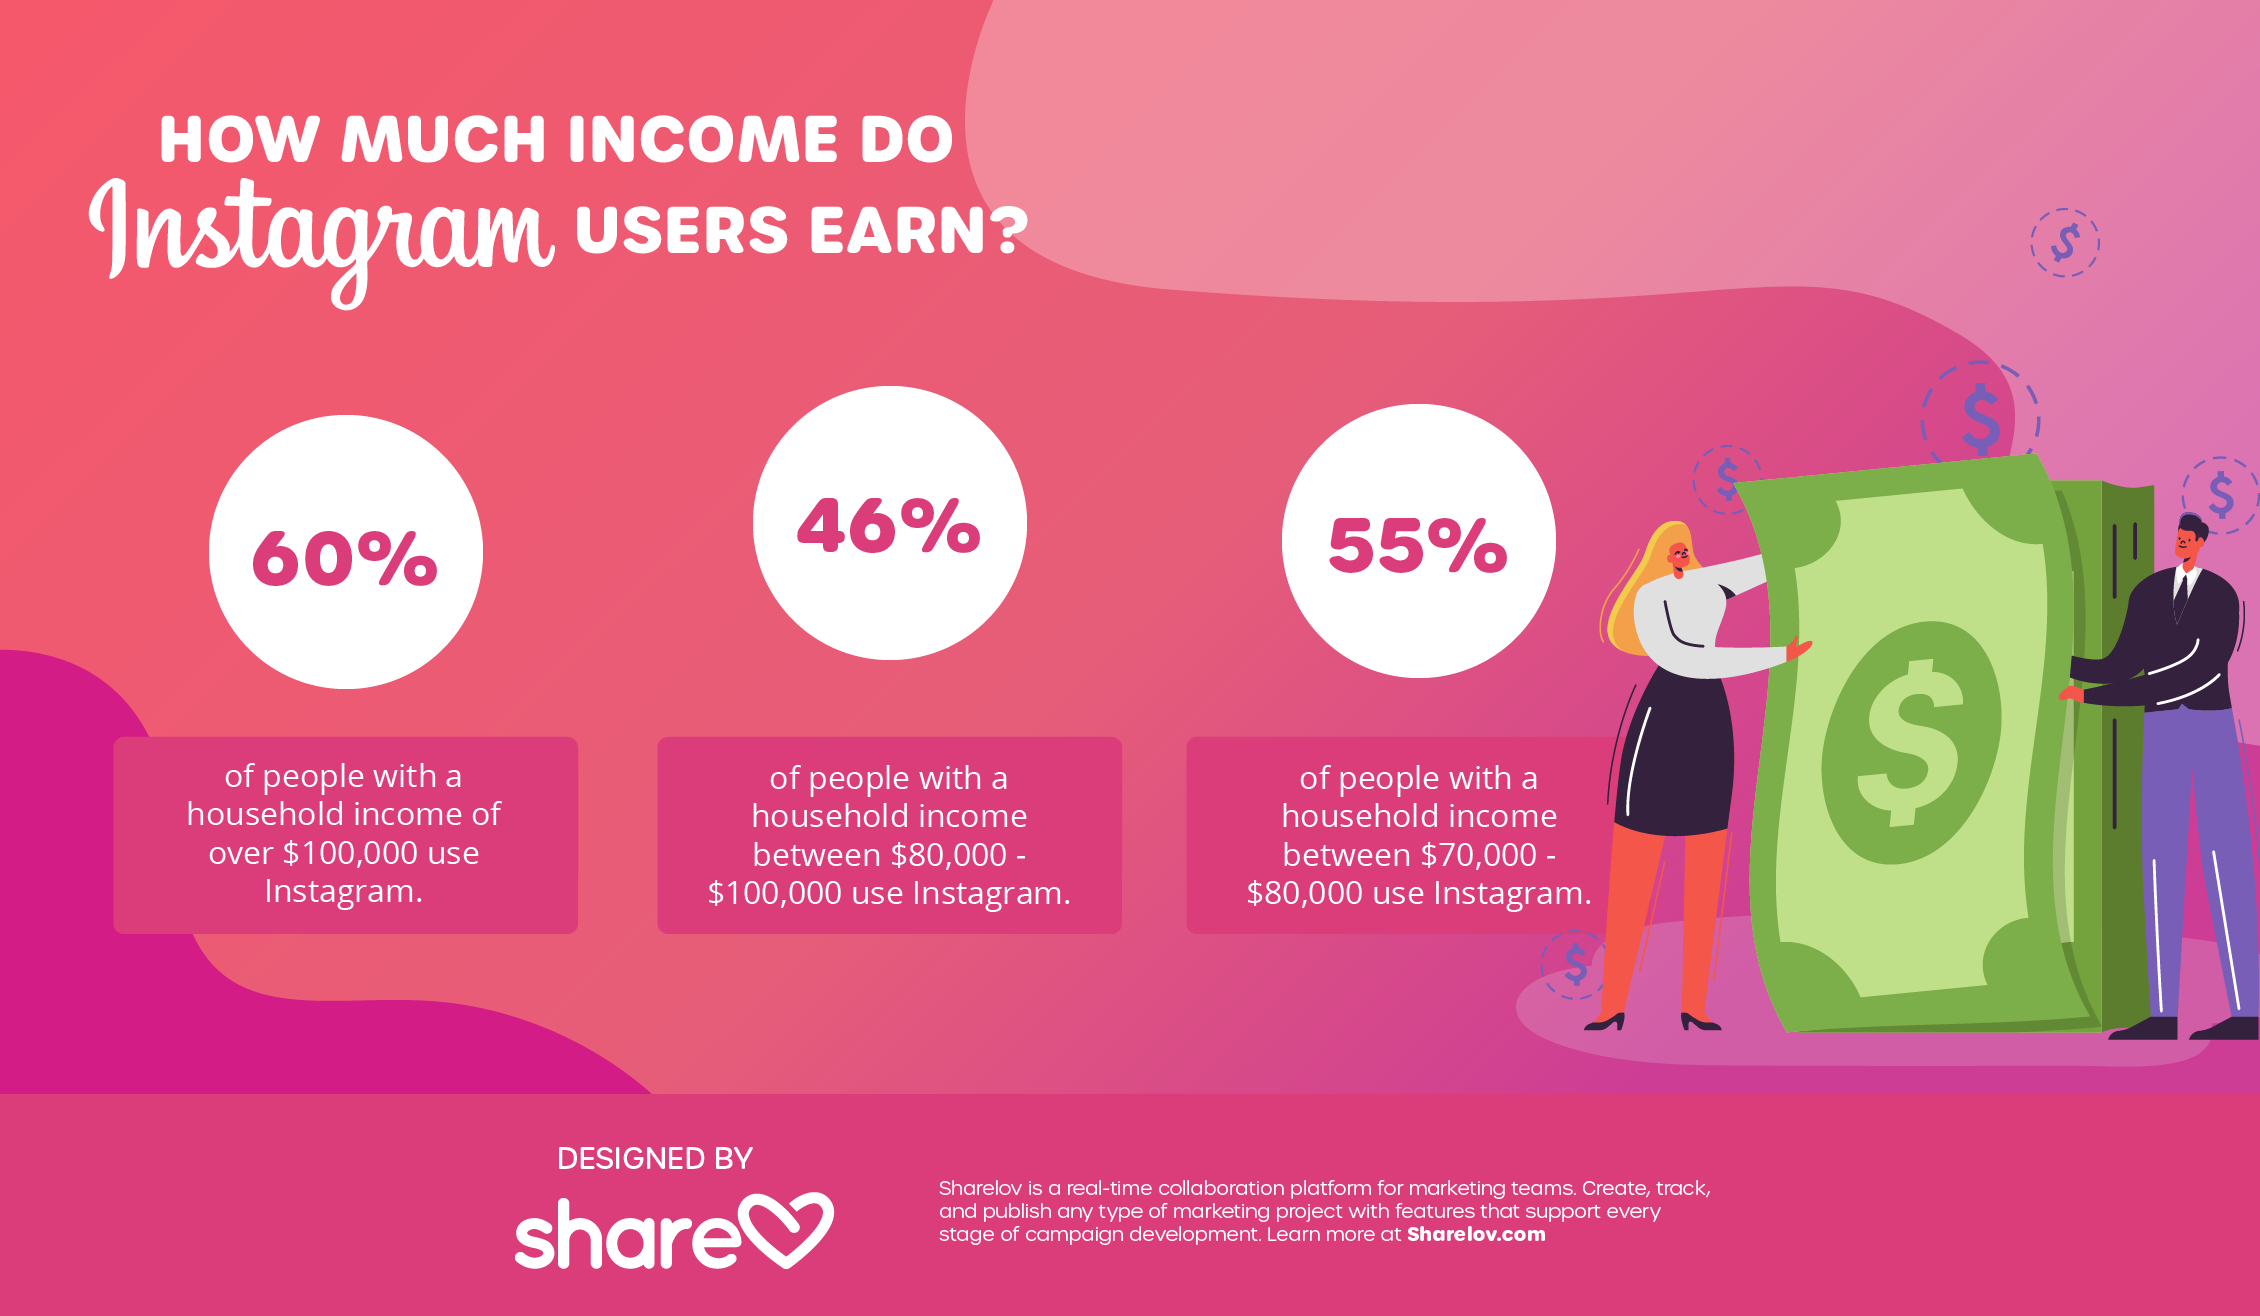
13. 60% of people with a household income of over $100,000 use Instagram.
14. 46% of people with a household income between $80,000 – $100,000 use Instagram.
15. 55% of people with a household income between $70,000 – $80,000 use Instagram.
How old are Instagram users?
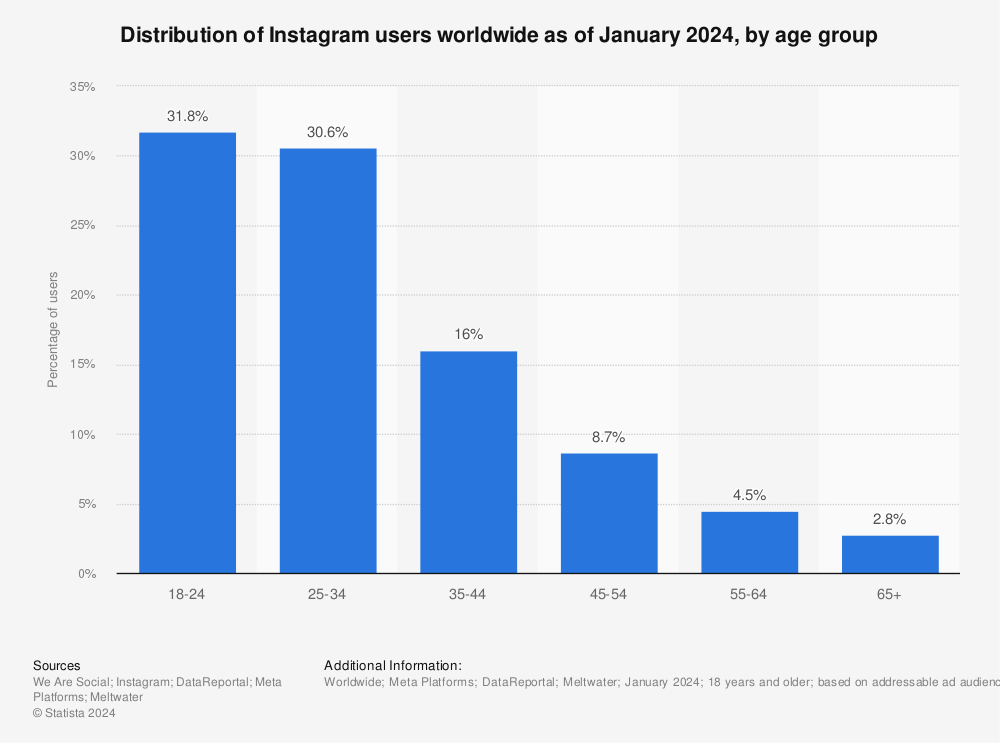
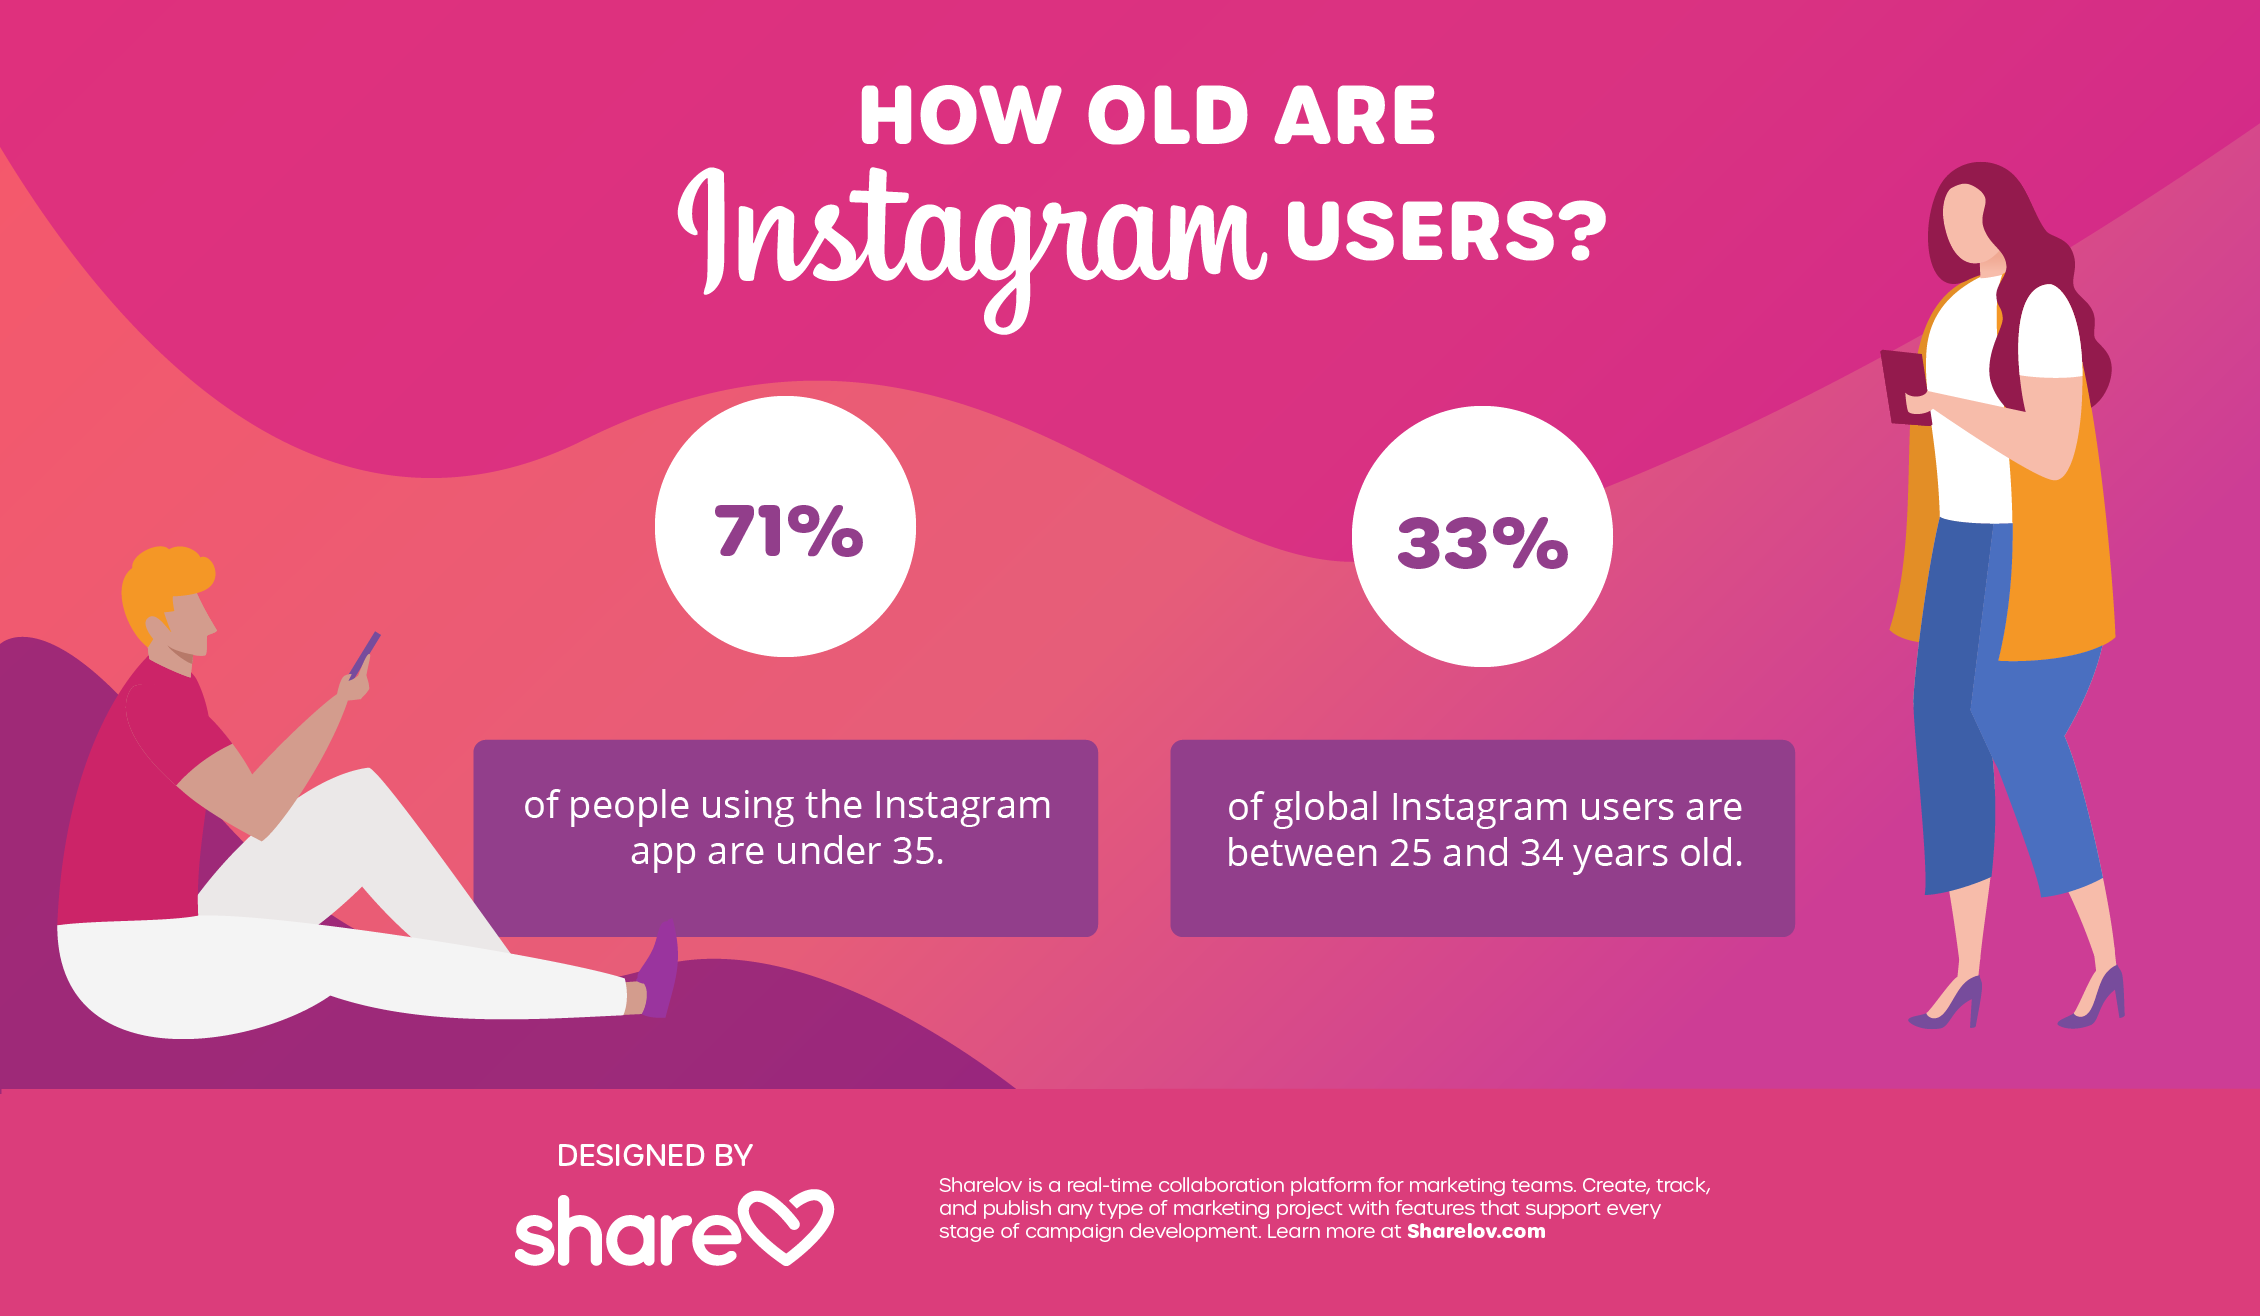
16. 71% of people using the Instagram app are under 35.
17. 33% of global Instagram users are between 25 and 34 years old.
18. 64% of U.S. adults under the age of 30 in the U.S. use Instagram (Jan 2018, Statista)
19. 40% of U.S. adults ages 30 – 49 use Instagram (Jan 2018, Statista)
20. 21% of U.S. adults ages 50 – 64 use Instagram (Jan 2018, Statista)
21. 10% of U.S. adults ages 65 and older use Instagram (Jan 2018, Statista)
What country are Instagram users from?
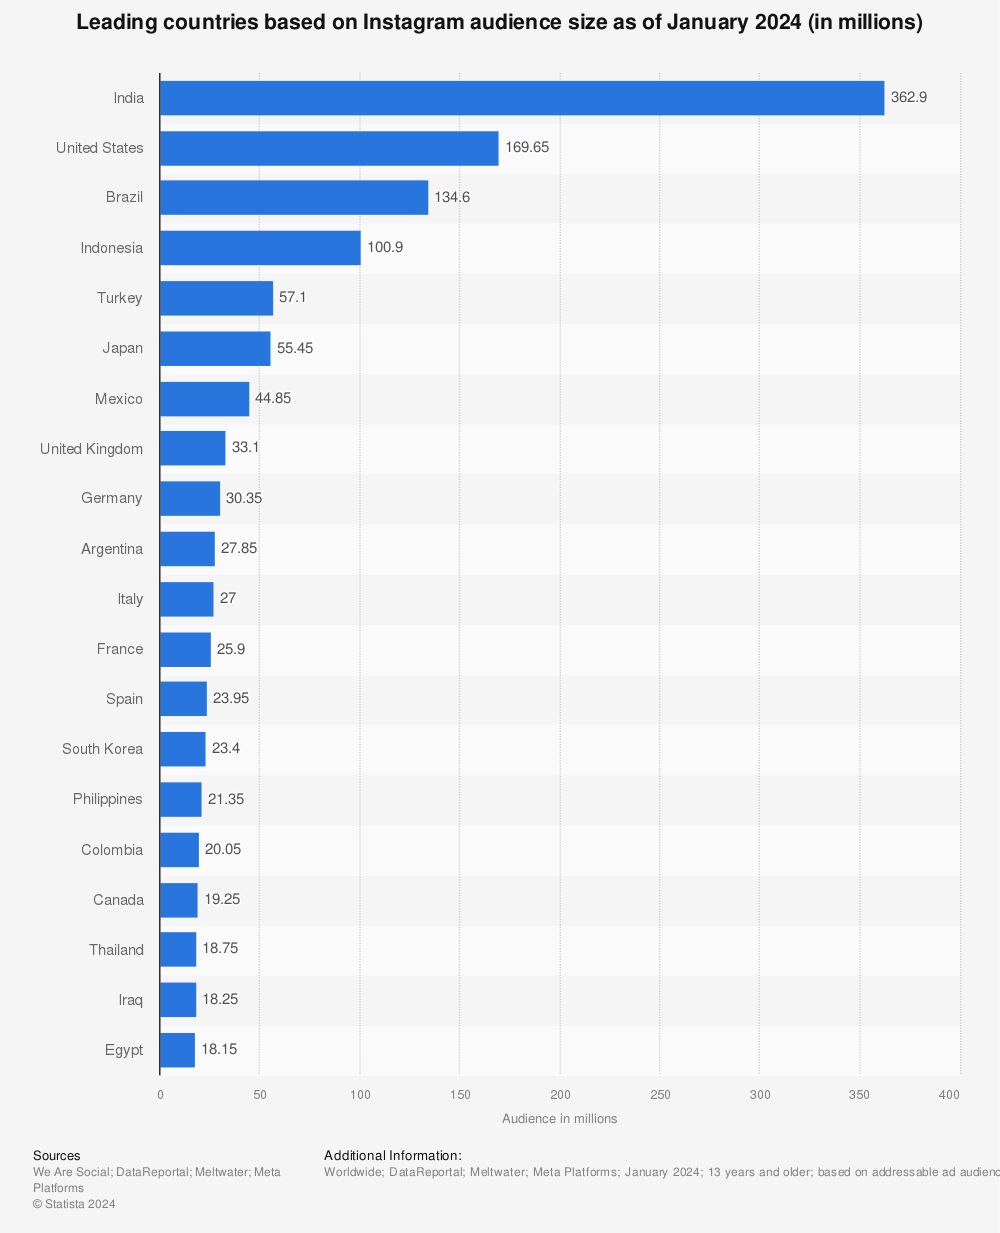
22. The U.S. has the most Instagram monthly users (Jan 2019) – 120 million people.
23. India has the 2nd-largest number of monthly Instagram users – 75 million people.
24. Brazil has the 3rd-largest number of monthly Instagram users – 69 million people.
Who are Instagram Users?
How much activity is normal for Instagrammers?
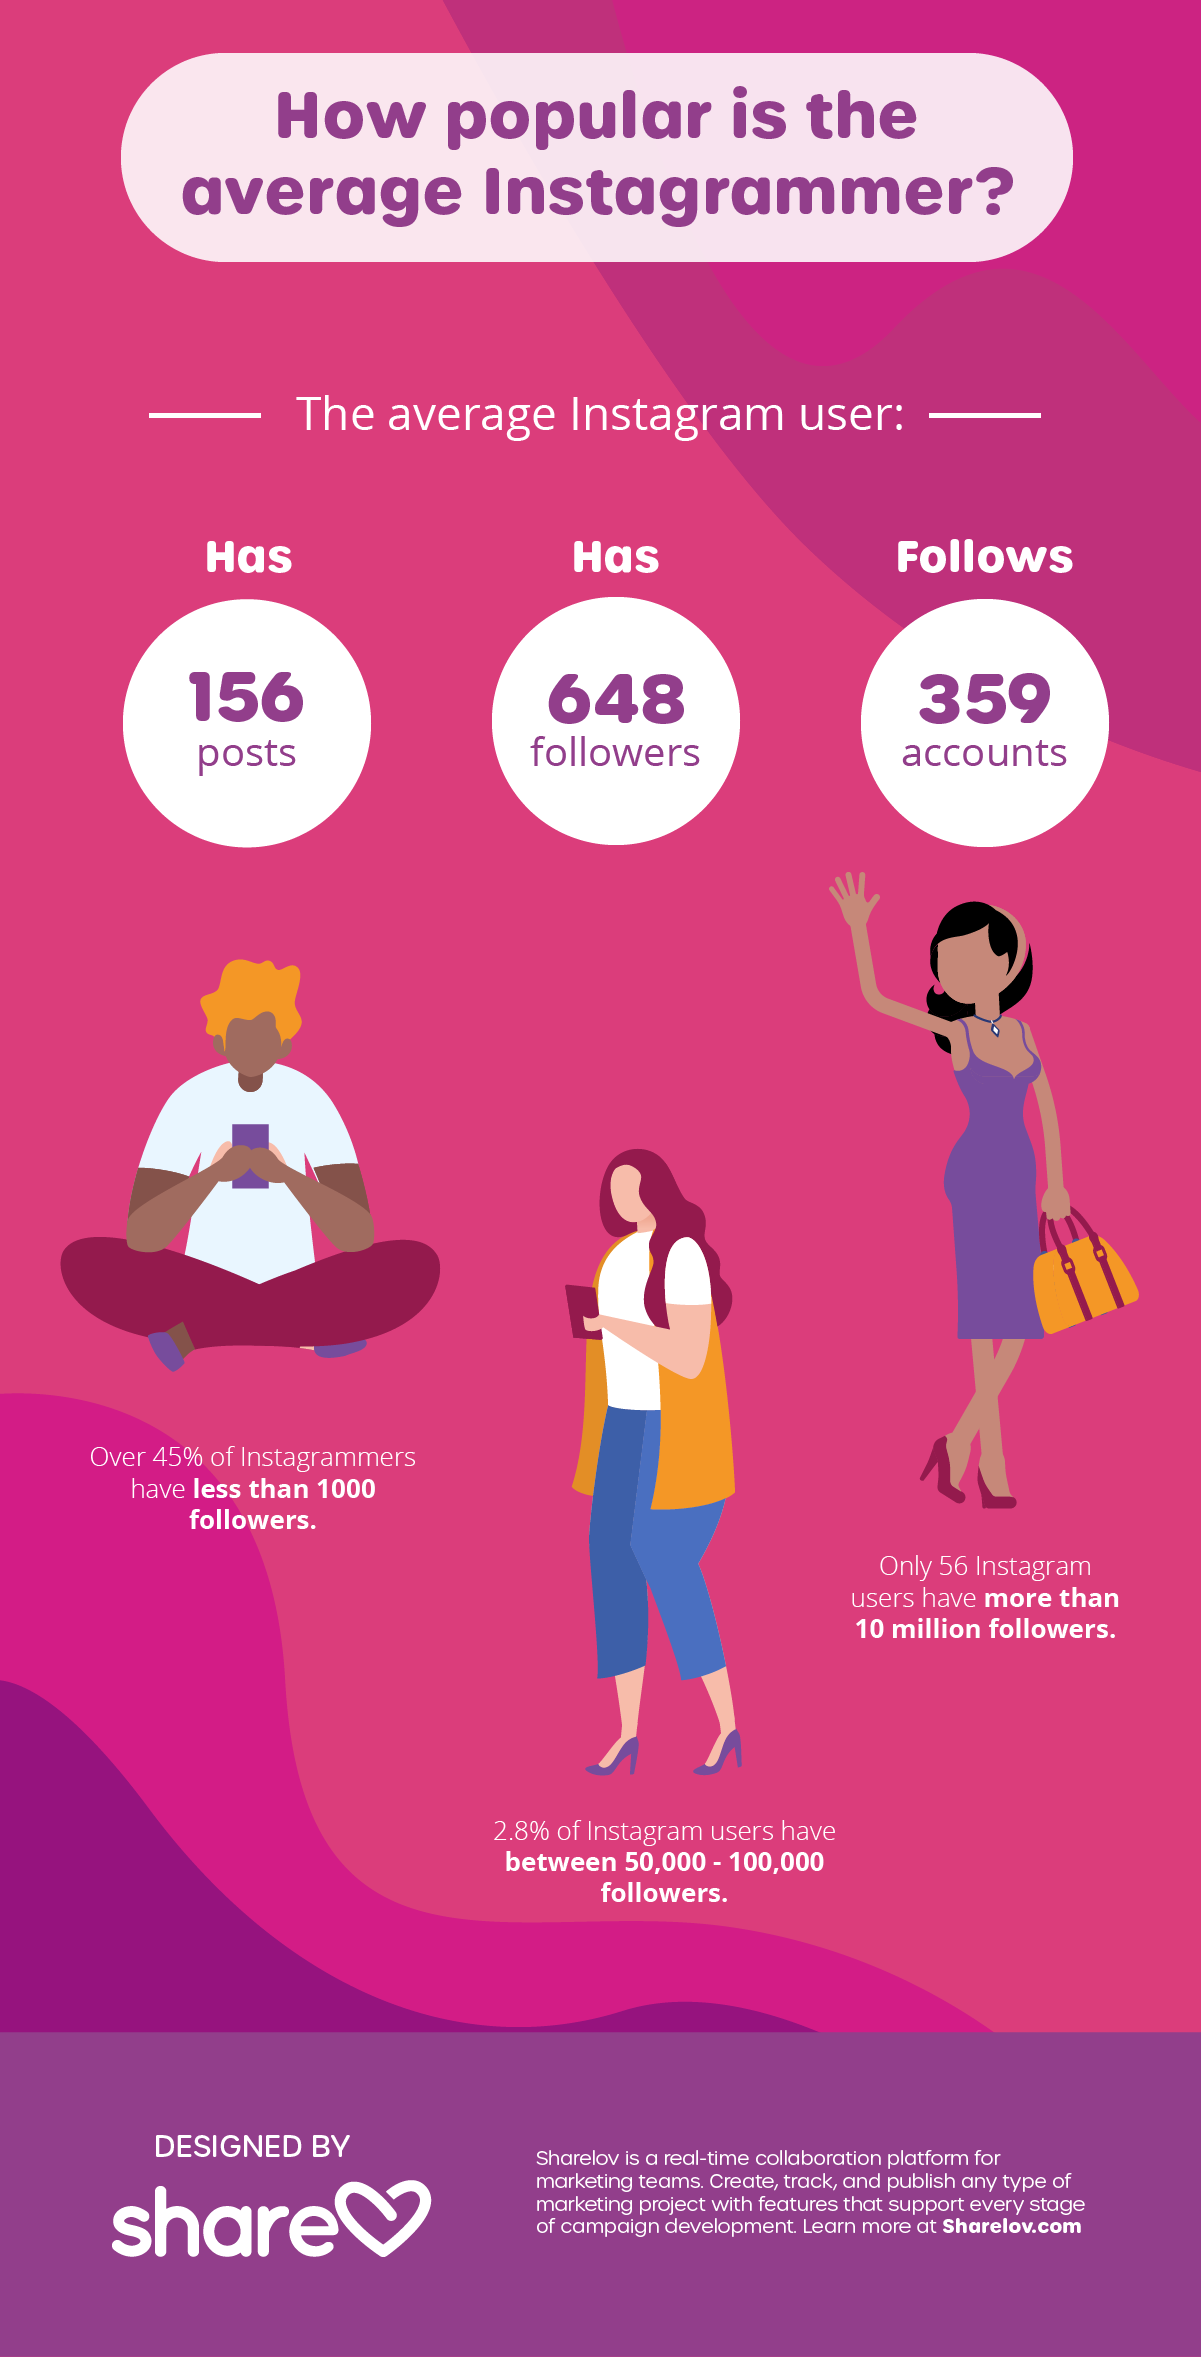
- Has 156 posts
- Has 648 followers
- Follows 359 accounts
28. Over 45% of Instagrammers have less than 1000 followers.
29. 2.8% of Instagram users have between 50,000 – 100,000 followers.
30. Only 56 Instagram users have more than 10 million followers.
How People Use Instagram
31. 1 billion Instagrammers are active every month. That’s 25% more people that used the platform than in 2018!
32. 500 million Instagrammers accounts are active every day.
33. The average engagement rate on Instagram is 1.2%.
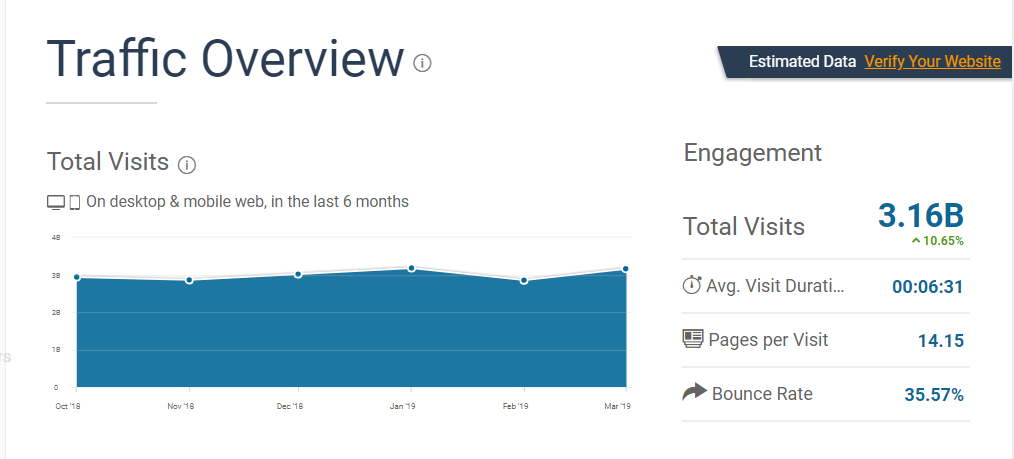
34. The average Instagram visit is 6 ½ minutes.
35. People view an average of 14 pages per Instagram session.
36. Instagram’s average bounce rate is 35%.
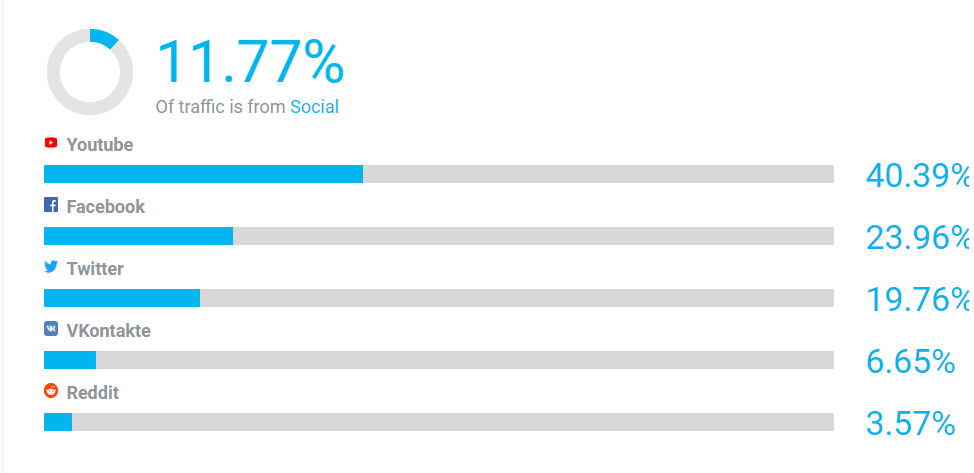
37. Almost 12 % of IG traffic comes from other social sites like YouTube, Facebook, and Twitter.
How people create posts
38. The average Instagram post contains 1.014402684 hashtags.
39. The most popular hashtags on Instagram are: “#love” “#instagood” and “#fashion” (Mention report, 2018).
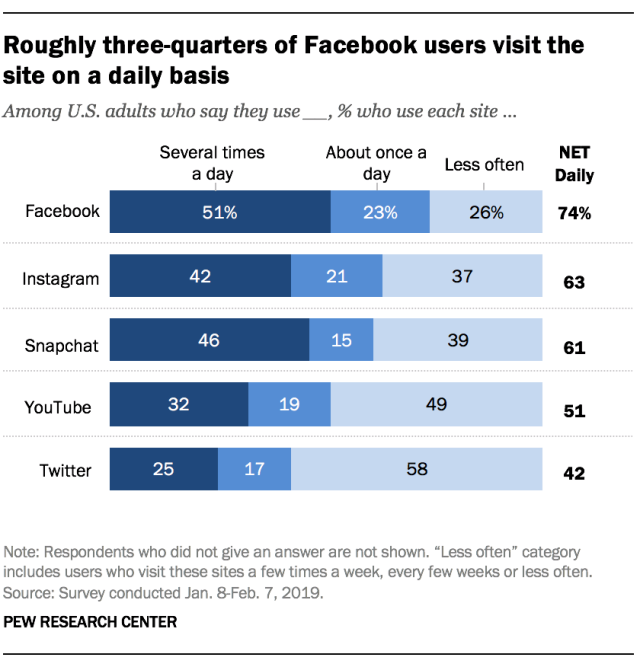
40. 42% of Instagram users visit the site several times a day.
41. 21% of Instagram users visit the site once a day.
42. 37% of Instagram users visit the site less than once a day.
How to Boost Engagement, Growth, and Conversions
43. The length of a user’s Instagram bio has no effect on the number of followers.
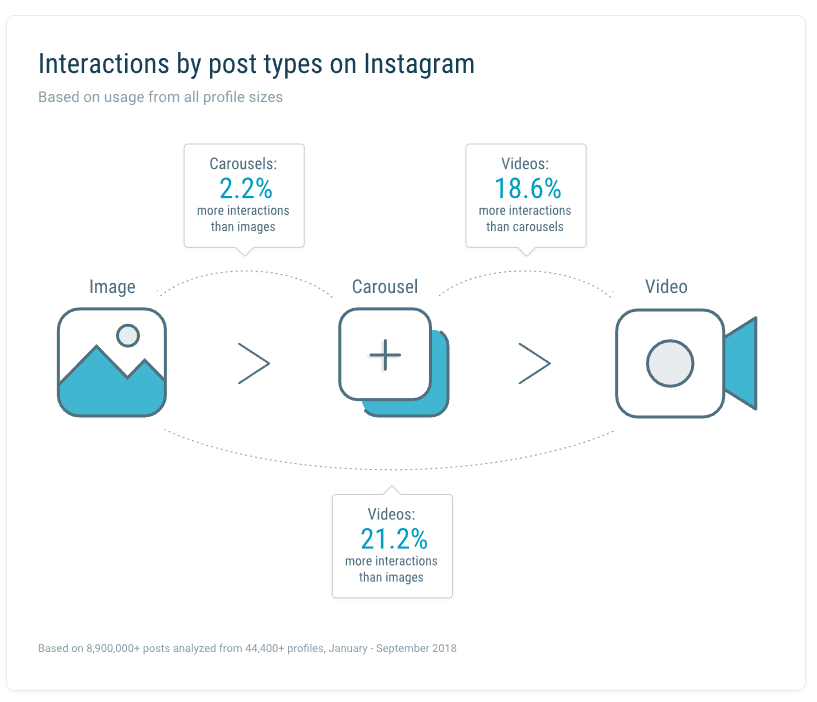
44. Videos get up to 21% more engagement than other posts.
45. Videos get 18.6% more engagement than carousels.
46. Video posts receive more than 2x more comments than other types of posts.
47. Carousels get about 2% more interaction than images.
About Instagram captions
A recent Quintly study of over 8.9 million posts discovered these facts about Instagram captions:
48. Over 30% of Instagram posts contain 300 or more characters in the captions.
49. 29% of Instagram posts contain between 50 – 150 characters in the caption.
50. Brands with 1 million followers or less got the most interaction from posts with 1 – 50 characters.
Wondering how many emojis to include in your Instagram captions? Here’s how many emojis-per-post got the highest number of interactions:
51. Brands with 0 – 1,000 followers: 1-3 emojis
52. Brands with 1,000 – 10,000 followers: 4 – 10 emojis
53. Brands with 10,000 – 1 million followers: 10 or more emojis
54. Brands with over 1 million followers: 1 – 3 emojis
Be careful when using hashtags in Instagram captions!
55. A 2019 study by Hubspot reveals that using more than 1 hashtag in a caption decreases your average engagement rate.
Mentions in captions are becoming more popular.
56. Around 40% of Instagram posts currently have no mentions, compared to last year when 72% of posts had no mentions.
What’s in a Post?
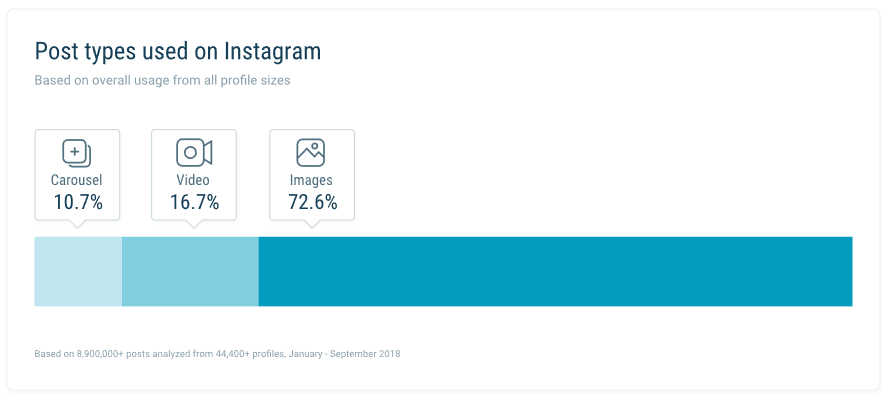
57. About 70% of Instagram posts are images.
58. About 17% of Instagram posts are videos.
59. About 11% of Instagram posts are carousels.
All About Instagram Brands
60. There are over 25 million businesses on Instagram.
61. Two-thirds of business profile visits come from people who aren’t following the business.
62. Instagram has 2 million monthly active advertisers.
63. An estimated 71% of US businesses are on Instagram.
64. One-third of the most-viewed Instagram Stories are from businesses.
65. 96%of U.S. marketers plan to continue using Stories ads.
66. 50% of businesses on Instagram created at least one Story a month.
67. Brands with 1 – 1k fans post less than 5 images a month.
68. Brands with 1k – 10k fans post about 12 images a month.
69. Brands with 10k – 100k post 24 images a month.
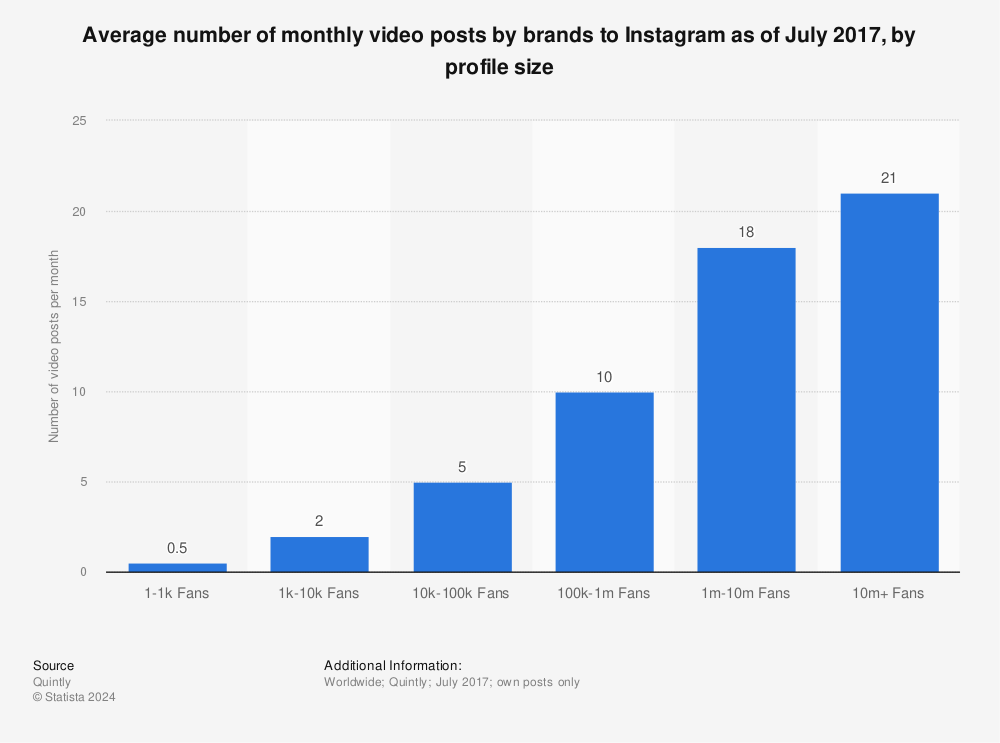
70. Brands with 1 – 1k fans post less than 1 video per month
71. brands with 1k – 10k fans post videos 2X/month
72. Over 80% of businesses on Instagram say engagement their most important metric.
73. Most top brands (60%) use the same filter for every post.
74. Most marketers are willing to spend anywhere from $25,000 to $100,000 on influencer marketing.
75. User-Generated Content Has a 4.5% Higher Conversion Rate.
76. Posts With a Location Get 79% More Engagement.
77. Photos With Faces Get 38% More Likes.
78. 50% of Instagram Captions & Comments Contain Emojis.
79. When Dunkin’ tested video ads on Instagram Stories with the polling sticker feature, it found that including the polling sticker drove a 20% lower cost per video view.
80. The average Instagram influencer charges about $1,000 per 100,000 followers for a sponsored post.
82. 55.4% of influencers use Instagram Stories for sponsored campaigns
83. Over 50 billion images have been shared on Instagram.
84. By the end of the year, one-fourth of Facebook’s ad revenue is expected to come from Instagram.
85. More than one-third of Instagram users have bought something online using their mobile devices.
The Instagram “like” button is used about 4.2 BILLION times per DAY!
Stay updated! Subscribe to our email list and we’ll let you know when new statistics are added to this list.
How do you use statistics to improve your content marketing? Drop us a note in the comments below!

