Imagine you had a fool-proof path to massive success on Instagram.
A path that offers a data-proven method to increase your engagement, growth, and conversion rates on a steady basis…
That path does exist, and many brands are using it to dominate Instagram’s algorithm right this minute.
Instagram analytics deliver all the data you need for big wins on its platform — but you must know how to access and apply the information to your advantage.

We want your social media efforts to be profitable.
So, we’d like to show you how to use your brand’s insights to build your own data-driven process that helps you:
- Grow your audience as fast as possible
- Skyrocket your engagement rates
- Turn your popularity into profits $$$
Let’s Get Started!
Understanding Essential Instagram Analytics
In this section, we show you the top post, Stories, and audience metrics to monitor for your Instagram Business (brand) account.
Instagram analytics are provided, free of charge, to all business accounts through the Instagram Insights app.
However, to access your analytics from a computer, you must use third-party software such as Sharelov.
Sharelov is social media & marketing software that helps your team collaborate on and publish any type of marketing project. Its social media tools make marketing on platforms such as Instagram quick and easy — saving your team valuable time while also improving the results.
Sharelov’s Instagram analytics program lets you view layers of data related to your Instagram account, content, and audience. It also allows you to view Instagram analytics on your desktop and share the data with your team.
Even though analytics look simple in Sharelov, there are a few things you need to know about the metrics to build a structured path to success on Instagram — and we’re going to help you with that!
Whether you use Sharelov analytics (desktop or mobile devices) or Instagram Insights (mobile access only), this guide will help you understand how to interpret and apply the most important data for improved audience engagement, reach, and conversions.
We’ll start by taking a peek at the top metrics.
If you’re using Sharelov, begin by selecting the “Analytics” tab from your dashboard, then select the “Instagram” filter.
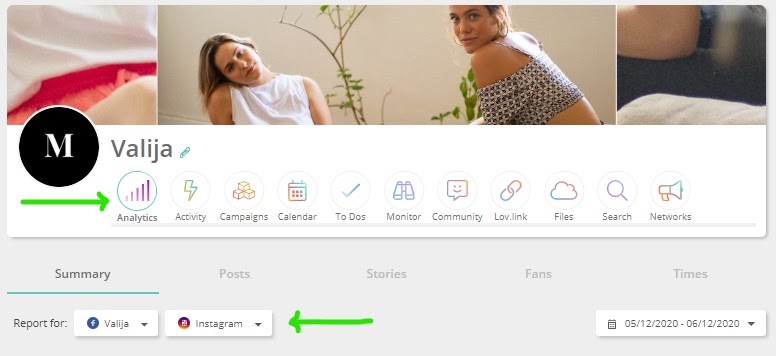
The Analytics tab has 5 sections, located in the submenu:
- Summary
- Posts
- Stories
- Fans
- Times
Be sure to select the Instagram filter to get started!
Instagram Daily Metrics
Keeping close tabs on your Instagram analytics helps you closely monitor the progress of your brand’s content and interactions.
Of course, most teams don’t have the time to scour the hundreds of pieces of data available on a daily basis. Instead, you can conduct a daily overview of your most-telling Instagram metrics.
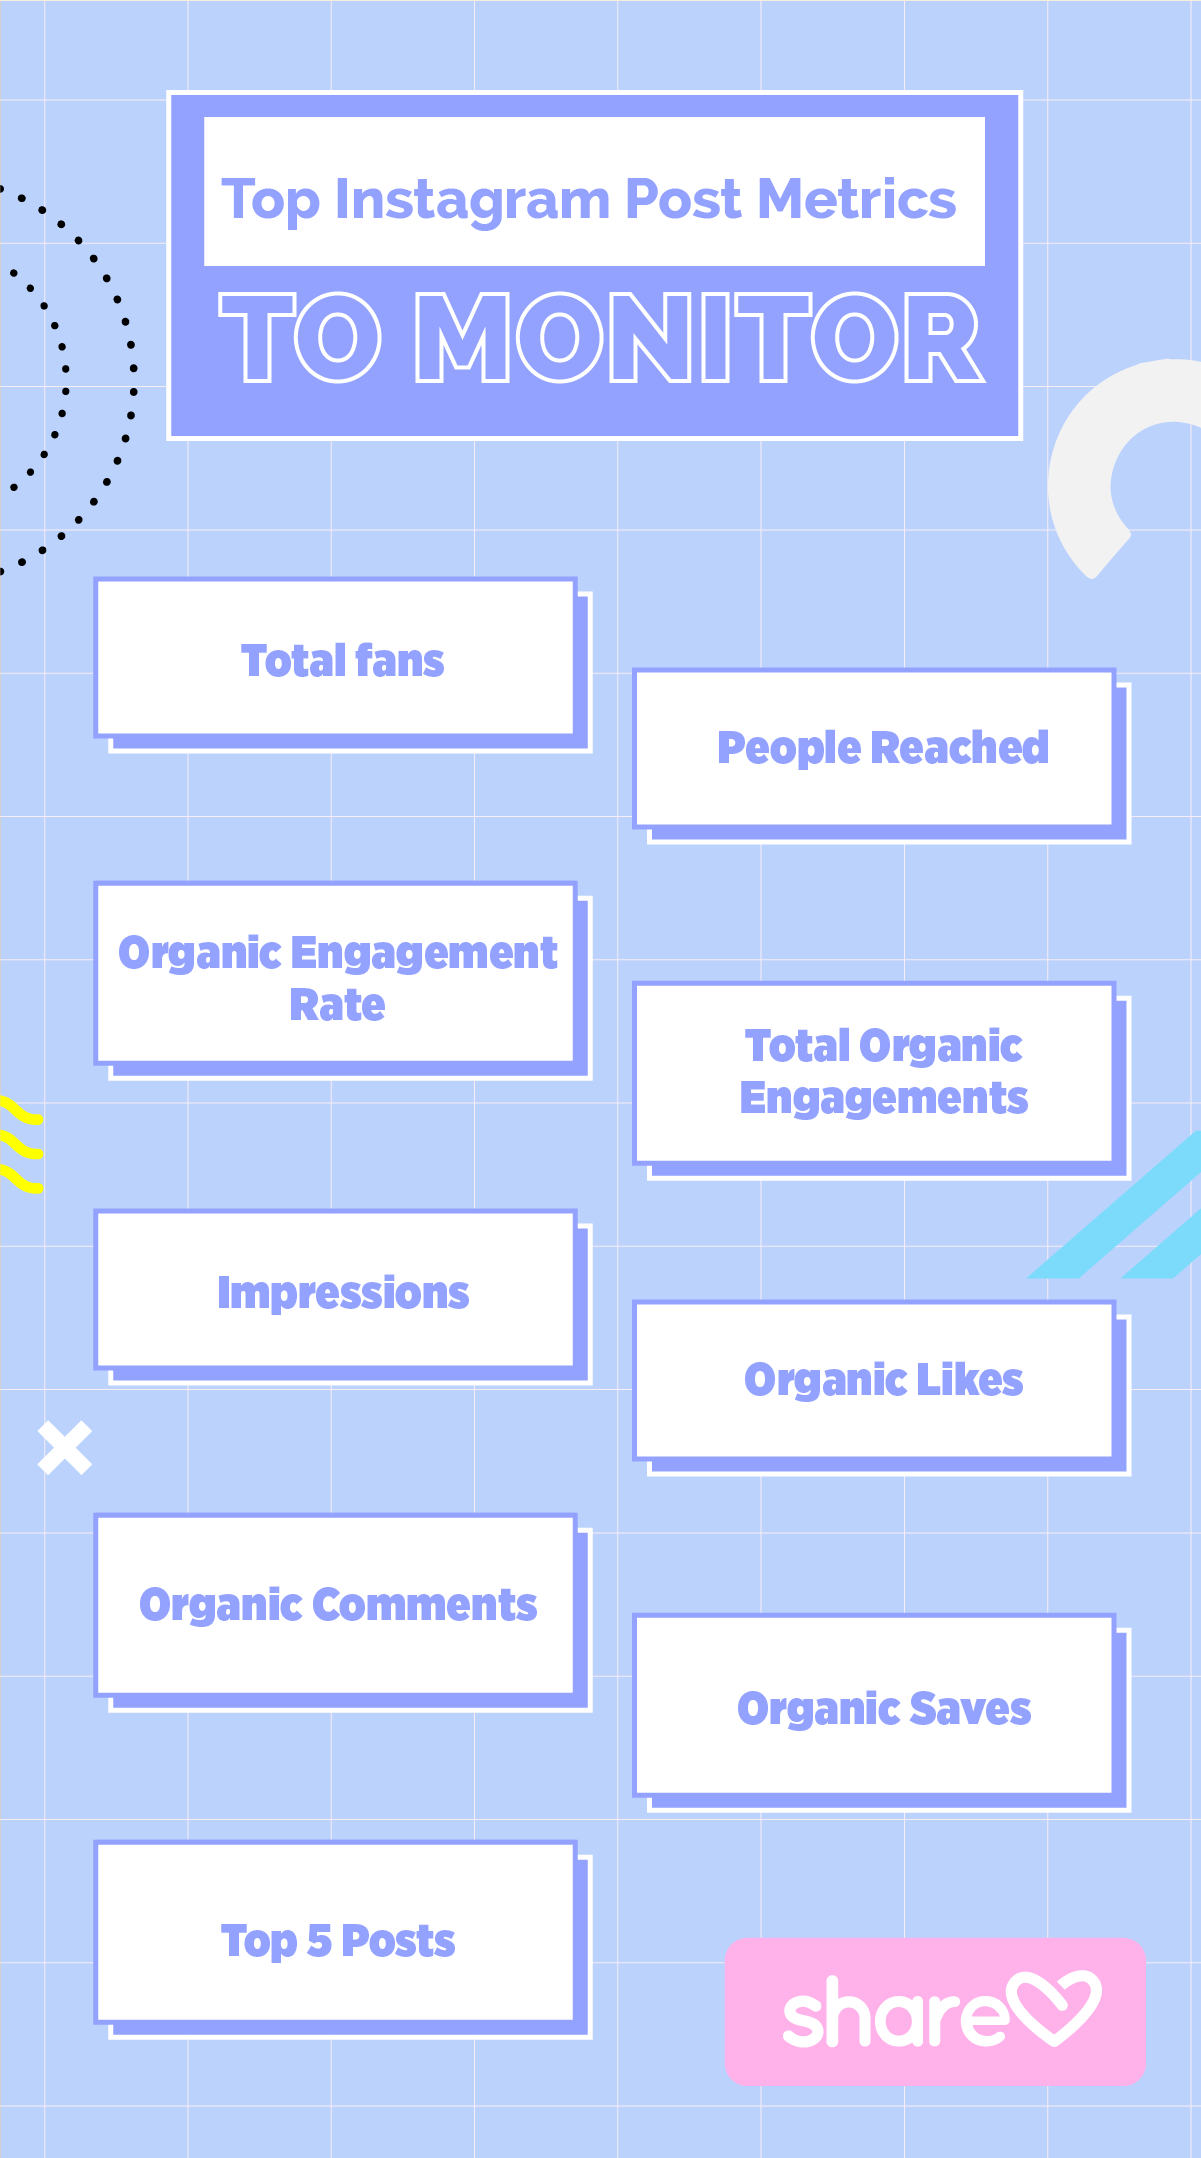
Consider monitoring the following Instagram post metrics on a daily basis:
- Total fans
- People Reached
- Organic Engagement Rate
- Total Organic Engagements
- Impressions
- Organic Likes
- Organic Comments
- Organic Saves
- Top 5 Posts (chart view only)
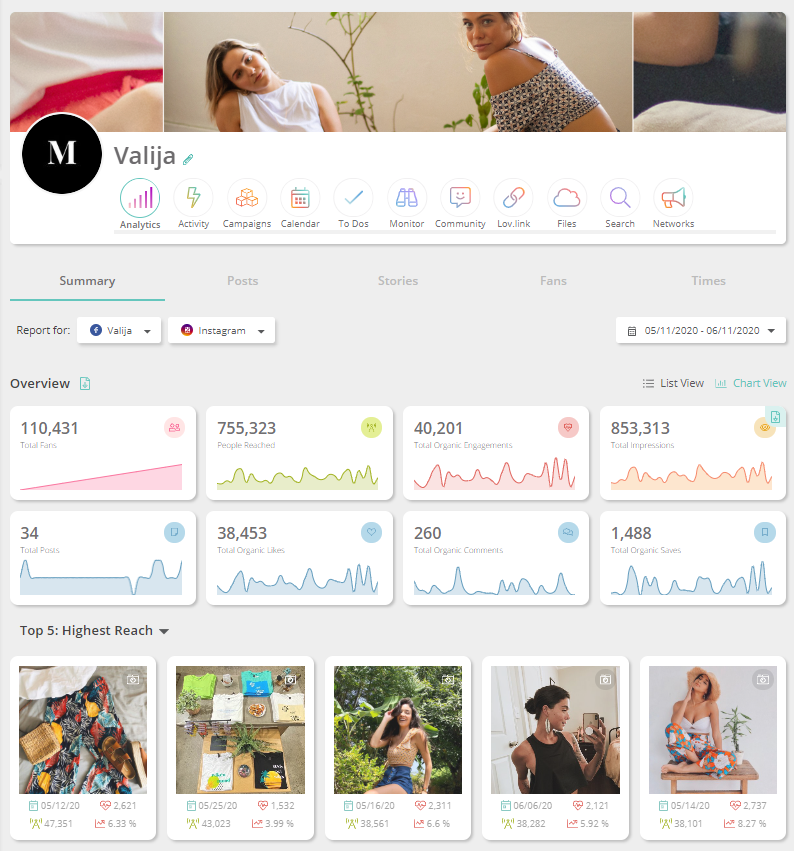
You can pull up these stats in seconds using Sharelov. From your dashboard, select “Analytics” from its main menu, then “Summary” from the submenu.
The analytics Summary tab instantly gives you an overview of your brand’s overall performance on Instagram, and can be viewed as a list or chart.
List View allows you to glance at all your top metrics in an instant.
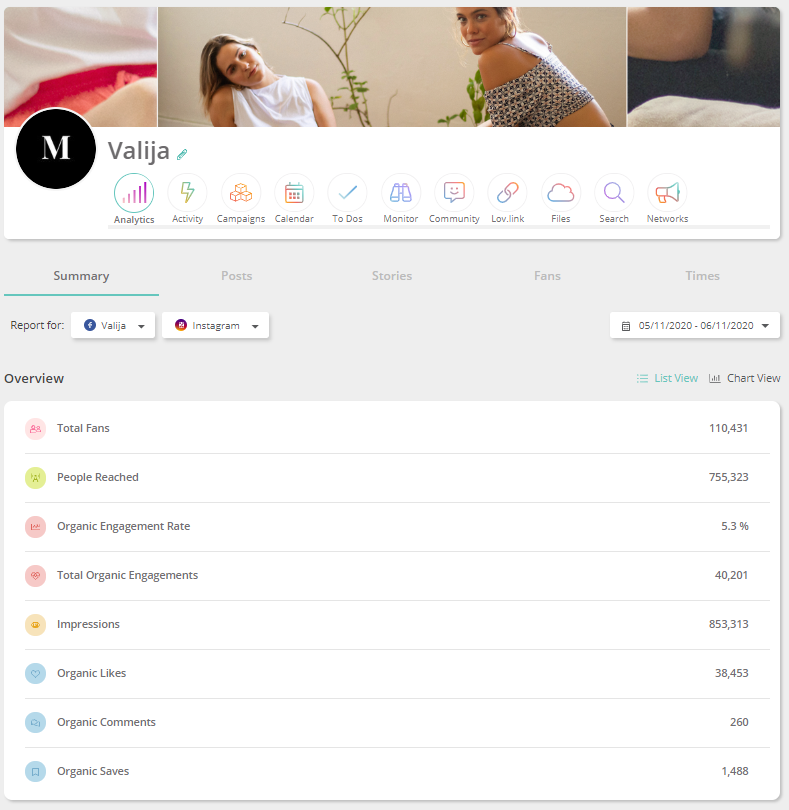
Chart View provides you with more detail and context.
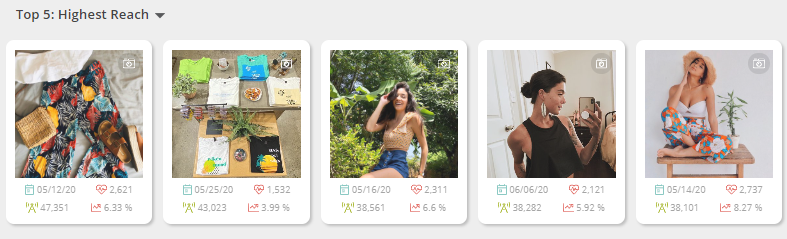
In Chart View, you can access your Top 5 Posts rated by reach, engagement, or recency.
Top 5 Posts by reach
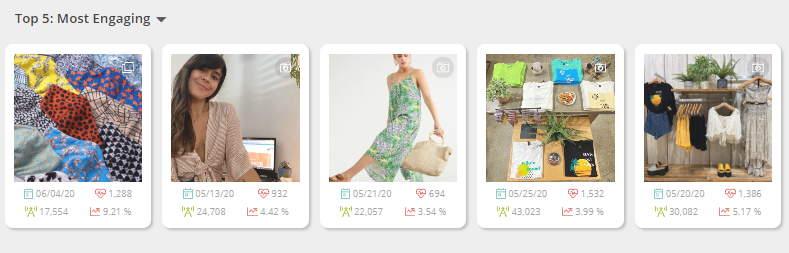
Top 5 Posts by engagement
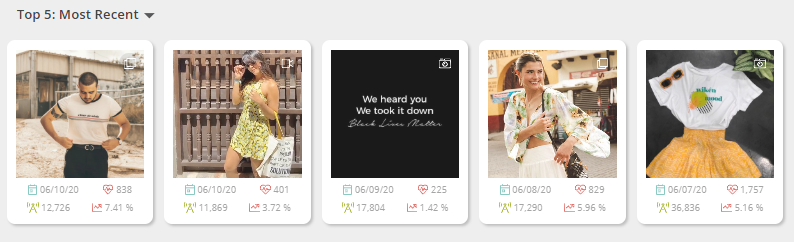
Top 5 Posts by recency
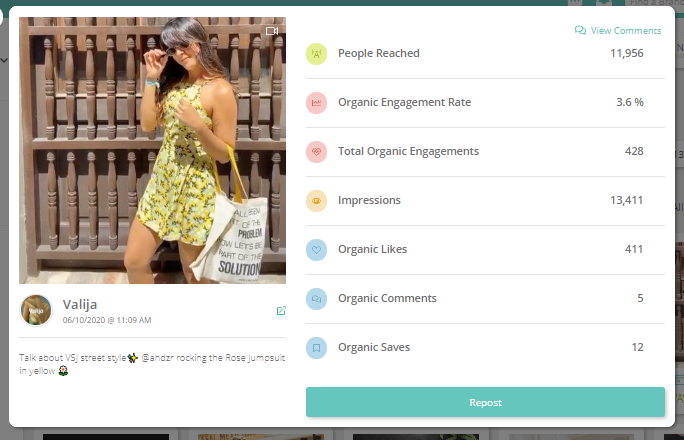
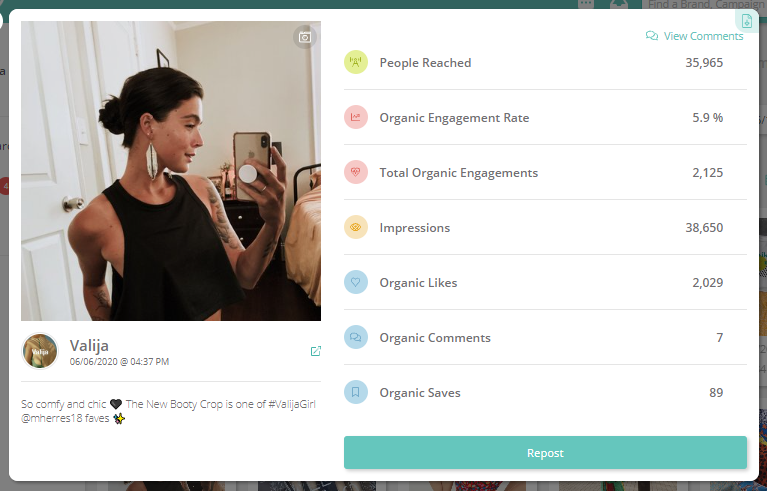
In Chart View, you can also access more details about your Top Posts with a single click.
Clicking on any of your Top Posts opens a detailed view of that post’s metrics. The Repost button also allows you to share the content to another campaign.
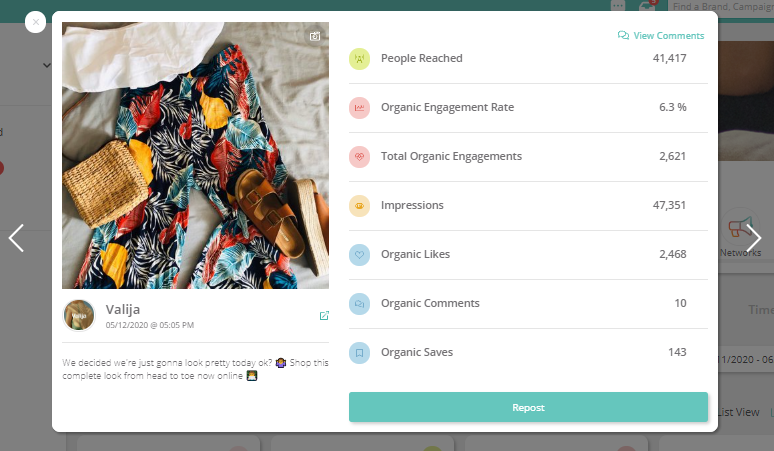
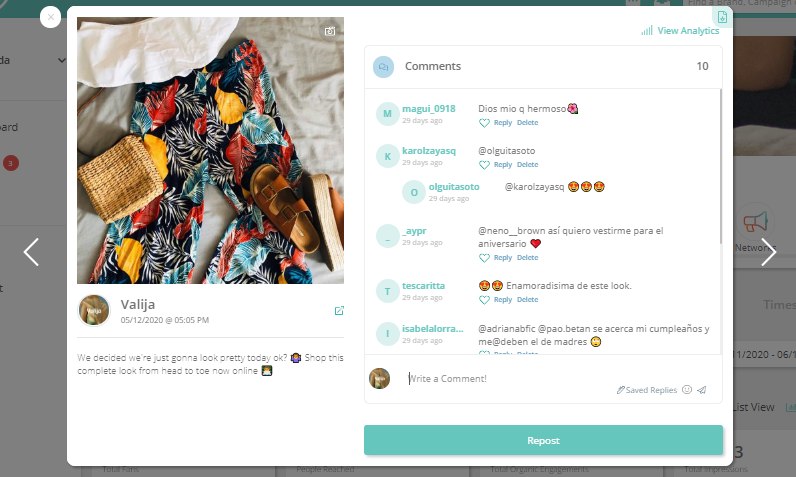
Click on View Comments (upper right hand corner) to respond to your latest comments and questions.
Daily reviews of your brand’s performance on Instagram only take a minute or two to conduct. Those couple minutes provide you with a significant advantage, though, because frequent monitoring lets you and your team know if you’re on the right track.
Instagram Post Metrics
Monitoring your Instagram post metrics shows you how well your campaigns and posts are performing. This lets you create more of the type of content your audience likes, interacts with, and shares with their friends.
The most helpful metrics for monitoring your post performance are:
- Engagement rate
- Comments
- Reach
- Total engagements
- Total reactions
To find these metrics, go to the Posts subsection of your Sharelov Analytics dashboard. This section provides you with detailed metrics for all your Instagram posts.
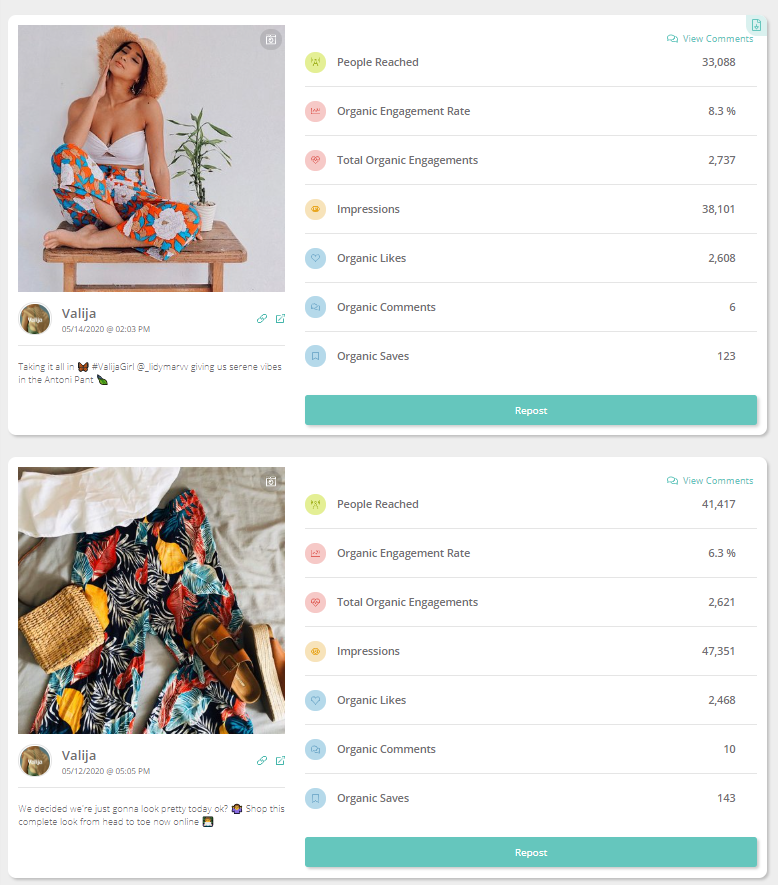
Using the All Metrics view allows you to scroll through individual posts, with the top metrics for each displayed in an easy-to-review format.
You can filter posts to display by date, or according to engagement rates, comments, reach, total engagements, or total reactions.
In the Highlights view, you also can filter your view to display posts by date or in order of performance.
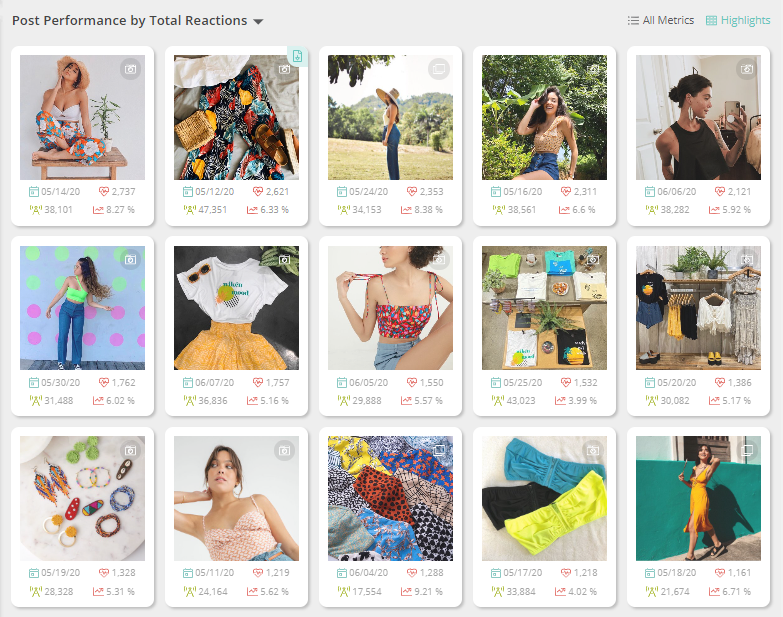
Highlights view provides you with more analytics, though.
Click on any post to pull up in-depth metrics on its content performance, view and reply to comments, or repost to another campaign.
Reviewing your post metrics on a regular basis lets you know how well each piece of content is performing.
Follow these analytics closely to learn what type of posts your audience responds to, so you can create more highly-engaging content!
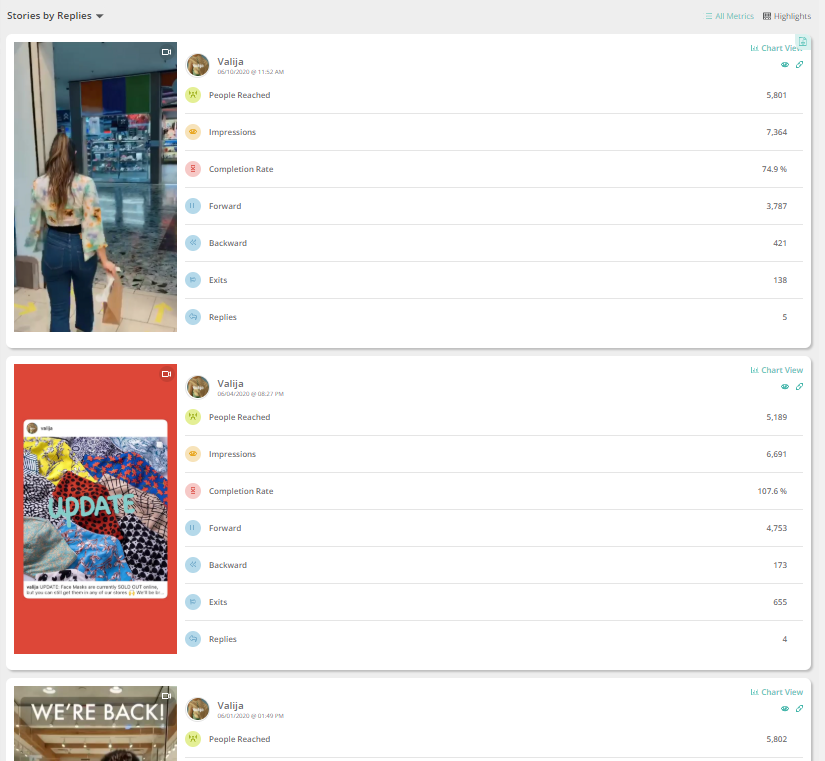
Instagram Stories Metrics
Instagram Stories are often the first place followers look when they want to know more about a brand, so understanding your Stories analytics is essential to your success!
The top metrics to follow for Instagram Stories include:
- People reached
- Impressions
- Completion Rate
- Forward
- Backward
- Exits
- Replies
You can quickly find these analytics from your Sharelov dashboard by going to Analytics and selecting the submenu Stories.
Highlights view gives you an overview with data on each post’s reach and impressions displayed.
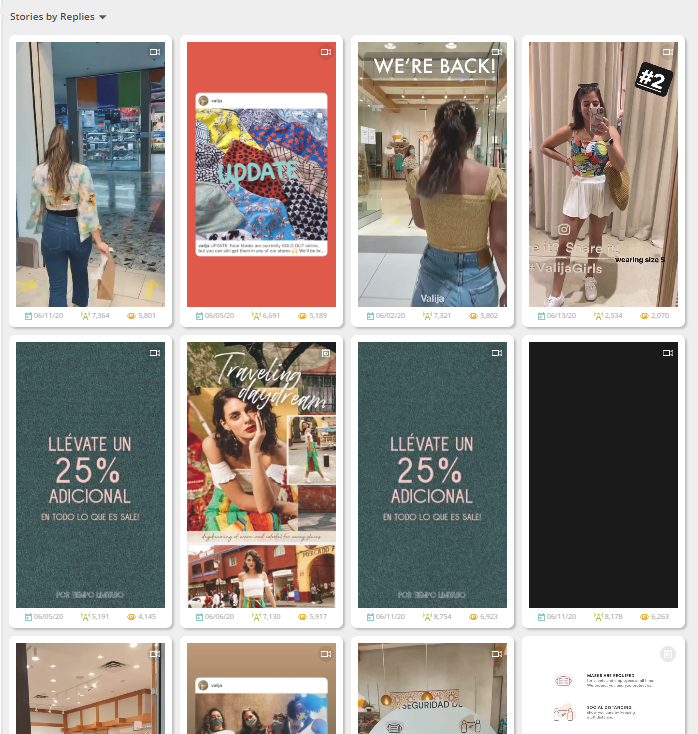
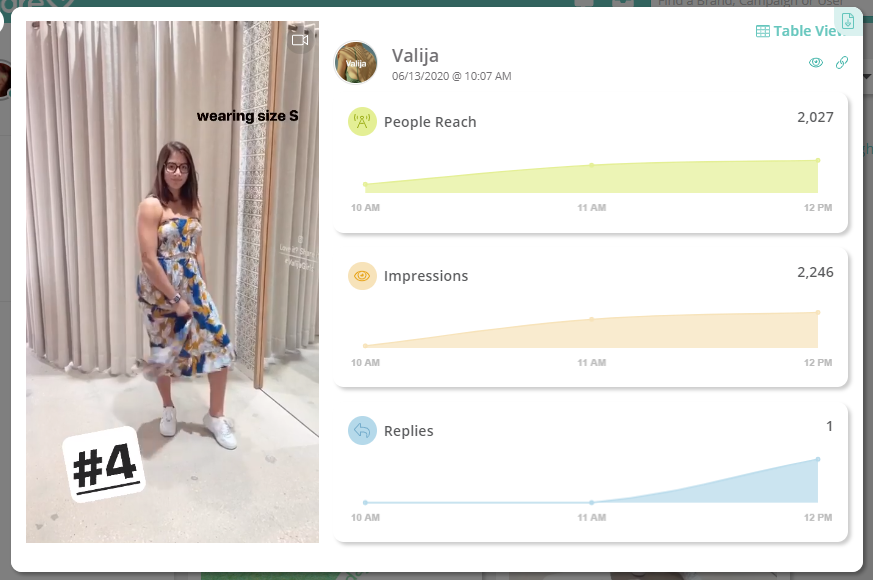
Bring up in-depth metrics for any Instagram Story by clicking on its card. You can view individual Story analytics as a chart or table, and watch your Story as you’re reviewing its metrics.
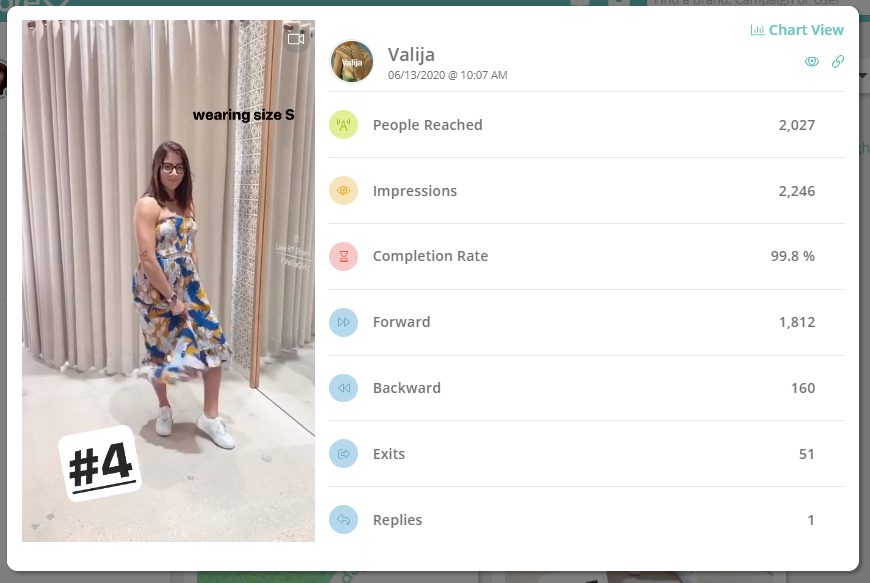
Or, choose the All Metrics view to scroll through individual Stories with data.
Instagram Audience Metrics
Audience data lets you learn more about your followers so you can better tailor your content and responses for a more engaged, loyal audience.
The most-helpful audience metrics are:
- Age
- Gender
- Top Countries
- Top Cities
- Top Languages
To quickly pull up your Instagram Audience analytics, navigate to Analytics (from your Sharelov dashboard) then choose “Fans” from the submenu.
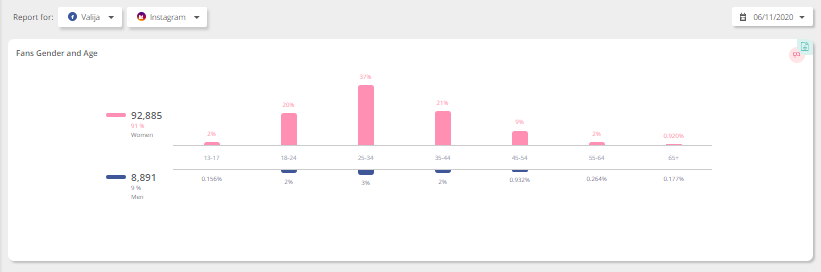
In the Fans section, you can quickly and easily review the following audience data:
- Percent of women vs. men
- Number of women vs. men followers
- Percent of women and men in the following age groups:
-
- 13 – 17
- 18 – 24
- 25 – 34
- 35 – 44
- 45 – 54
- 55 – 64
- 65+
- Top Countries: bar chart, scroll over for numbers
- Top Cities: bar chart, scroll over for numbers
- Top Languages: bar chart, scroll over for numbers
Understanding your audience helps you create more tailored content and better respond to followers’ comments, ultimately resulting in greater brand awareness, engagement, and customer loyalty.
Best Times to Post Metrics
Posting when your audience is online and engaged can have a significant impact on how people interact with your Instagram content.
To discover the best times to post your Instagram content, review your audience’s behavior metrics to learn when they’re most likely to log on and engage on Instagram.
You can instantly access this data from your Sharelov dashboard by navigating to the Times subsection of your Analytics dashboard in Sharelov.
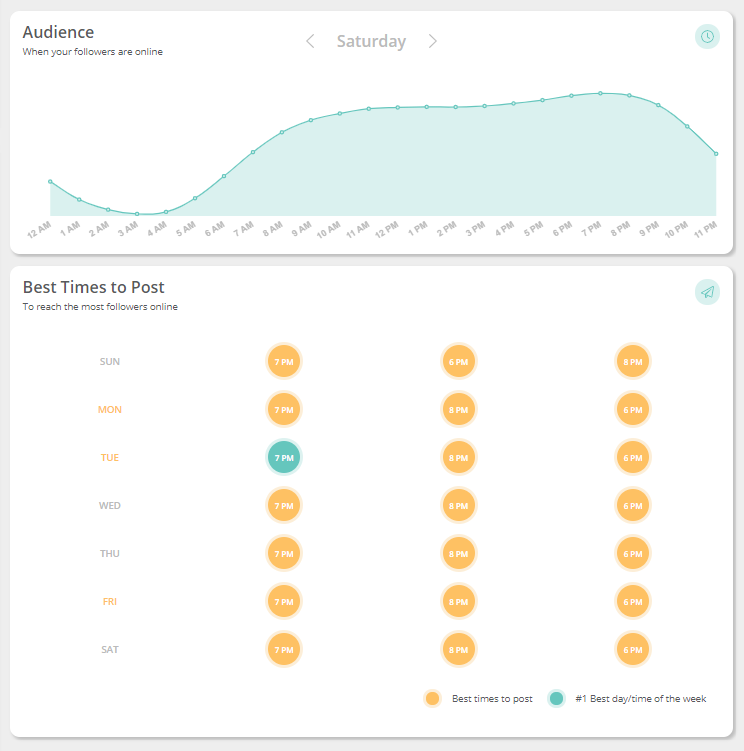
Review the dates and times your audience is most likely to be online, then create a content calendar around the best times to post.
When you use Sharelov to access Instagram metrics, you also get suggestions for the best time to post, allowing you to skip the time it takes to review the metrics on every day and time slot!
Understanding In-Depth Instagram Analytics
Using your mobile phone, you can access additional metrics through Instagram Insights. In this section, we show you what metrics are available through the Insights app, and explain what each represents.
1. Interactions
The Interactions section shows how many profile visits your account has had in the last week, and on what day of the week users visited your profile most.

This section also tells you how many people have tapped the interactive elements of your profile: website link, email button, phone number/call button, and address/directions button.
2. Discovery
The Discovery section shows you how many unique accounts you have reached and how many impressions your content has received during the last 7 days.

The graph at the top of this discovery section lets you see what days of the week your reach has been the largest. Some users may have other information available, such as where the impressions originated.
Content Performance: View Your Instagram Content Insights
The Instagram Insights Content tab displays information related to all the content you publish on Instagram.
The top of this section shows how many posts you’ve published in the past week versus how many you published in the previous week.

The Content tab has 3 main sections: (A) Feed posts, (B) Stories, and (C) Promotions.
In this guide, we’ll show you how to understand the insights of your feed posts and Stories.
A. Feed Posts
This section contains data related to all of the posts your business has published on Instagram in the past 2 years.
When you open this section, you’ll see your posts listed in order of popularity. From there, you can tap on “select all” to see the full data of all your content’s performance.


Feed post insights lets you apply up to 3 filters at one time.

This means you can sort data using endless filter combinations of content type + engagement action + time frame. Let’s take a look at the different data points and what they mean.
Filter 01: Content Type
Get specific with the content filter to find out exactly what type of posts your audience engages with or ignores.

The content-type filter offers the following choices:
- View All: Combines data from all of your posts – photos, videos, carousel posts, and shopping posts
- Photos: View only data from photo posts
- Videos: View only data from video posts
- Carousel posts: View only data from carousel posts
- Shopping posts: View only data from posts that contain items from your Instagram storefront
Filter 02: Interaction type
Discover how your audience is engaging with your content by using the Interaction filter.

This filter allows you to sort data according to the way users engage with the content type you chose in filter #1.
- Calls: The number of times users have tapped the “Call” button on your profile
- Comments: The number of times your posts were commented on
- Emails: The number of times users have tapped the “Email” button on your profile
- Engagements: The number of times your posts were liked, saved, or commented on.
- Follows: The number of accounts that started following you as a result of your posts.
- Get directions: The number of times people have tapped the “address” button on your profile.
- Impressions: The total number of times your posts show up in the newsfeedThis number may be bigger than the number of people who see your post (reach).For example, if friends share the same post, it may reappear in your newsfeed a 2nd or 3rd time (or even more). Impressions count the total number of times a piece of content has shown up in newsfeeds.
- Likes: The number of times your content was liked
- Profile Visits: The number of times your profile was viewed
- Reach: The unique # of users that have seen any of your posts
- Saved: The number of users that saved your posts
- Texts: The number of times users have messaged you
- Website Clicks: The number of times your website link was visited
Filter 03: Choose time period
Get specific with the content filter to find out when your audience is most likely to engage with your brand.
You can view by:
- 7 days
- 30 days
- 3 months
- 6 months
- 1 year
- 2 years
B. Stories
The Stories section shows you how many people interacted with your Instagram Stories.

Stories insights lets you apply 2 filters at one time. You can sort data using interaction type + time frame. Many of the Stories insights data points are the same as what we covered in the content section (above).
However, Stories have a few additional data points that you should become familiar with:
- Exited: Number of users that tapped away to leave your story
- Forward: Number of users that tapped forward to see the next photo or video in your story
- Link opens: Number of times a link in your Story was opened
- Next story: Number of users that tapped away from your Story and moved on to someone else’s Story
- Reach: Number of accounts that saw a photo or video from your Story
- Replies: Number of replies to a photo or video in your story

C. Time Period
You can view insights on your Instagram Stories for up to 14 days after they’ve been published.

Here are your time frame choices for Stories insights:
- 24 hours
- 7 days
- 14 days
Audience Insights: Learn More About Your Audience by Using the Audience Tab
The Instagram Insights Audience tab lets you get to know more about who your followers are and when they’re online.

Your audience insights share the following types of data:
- Gender: Displays the percentage of men versus women
- Age Range: Displays the age range of your followers
- Top Locations: Displays the top cities and countries of your followers
- Followers: What days of the week and hours of the day your audience is online
Building a Path to Success With Instagram Analytics
Analytics are a lot of fun to browse! But, the data by itself won’t help you increase your reach, engagement, or sales.
To build a solid path to success, you need to learn how to use the data to your advantage.
In this section, we’ll show you what you need to know to create a data-proven formula for your success.
What Type of Content Should You Post?
Your post, Stories, and audience metrics help you determine what type of content to post.
Take a close look at the metrics of your content performance.
- [tweetshareinline tweet=”What do your top 3 pieces Instagram posts have in common?” username=”sharelovapp”]
-
- Are they all videos?
- Do they have catchy comments or meaningful commentary?
- Are they all sharing a winning hashtag?
- Do the visuals share a similar color palette?
Work toward finding the common factor in your successful posts. Then, deliver more of it!
- What do your poorest-performing pieces of content have in common?
-
- Is there a video with a person talking without anything “happening” for long periods of time?
- Is it an image that came from a stock photo library?
[tweetshareinline tweet=”By analyzing your top-performing and lowest-performing content, you can begin to deliver more of what your audience loves to engage with.” username=”sharelovapp”] And, less of what it doesn’t care for.
Continue to test and analyze your content’s performance to improve your audience engagement rates.
When is the best time for your brand to post to Instagram?
[tweetshareinline tweet=”There are a couple metrics to watch when choosing the best time for your brand to post on Instagram:” username=”sharelovapp”]
- When is your audience most active?
- [tweetshareinline tweet=”Where is your audience from, and what time zone are they in?” username=”sharelovapp”]
[tweetshareinline tweet=”Simply looking at when your audience is online isn’t enough to determine when the best time is to publish your Instagram content.” username=”sharelovapp”]
What you really want to know is: When is your audience most likely to engage with brands?
By reviewing both your audience and post insights, you can begin to get a picture of when your target audience is most likely to engage with your content.
This may take a bit of testing, but once you find your “best times to post,” try to stick to a steady, consistent schedule.
The Quickest Way to Find Your Best Posting Times
If you’re using Sharelov, you can save quite a bit of time on research and analysis.
From your Analytics menu, just select Times to discover the best times to post for your audience (according to when they’re most likely to be online).
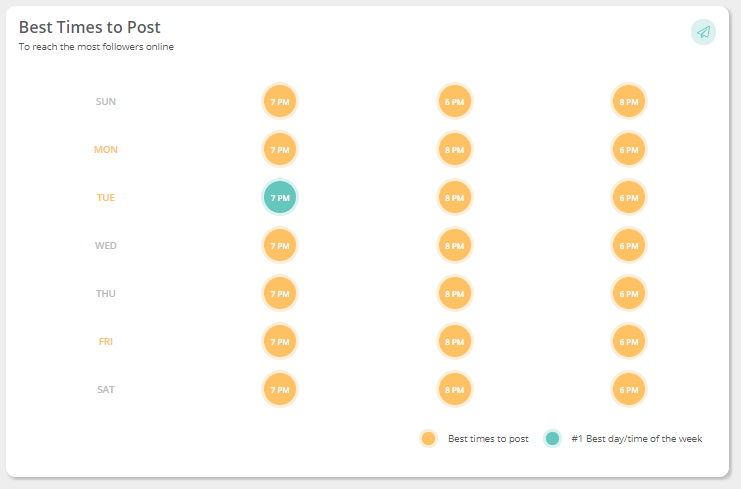
Your Best Times to Post chart provides you with the best times of day – and the best day of the week – to post your Instagram content.
The Times feature allows you to save time that would be better spent creating awesome content!

How To Reach Your Target Audience?
In order to convert your success on Instagram into product sales, you want to be sure that you’re reaching your target audience.
For example, if your target audience is men between the ages of 30 – 40, then check your audience metrics to find out how much of your interaction is coming from men in that age group.
Posting a vegan bread recipe that earns 5000 likes might seem like a successful post, but if you’re trying to sell men’s sports gear and getting high engagement from women, then you’re not reaching your target audience.
If your interactions are coming from people who aren’t going to buy your product, then your high engagement rates are nothing but a “vanity” metric.
It’s important to always keep your target audience in mind and check your audience metrics to be sure you’re reaching the right people!
Measuring and Improving Your Success Using Instagram Analytics
A. Finding your Instagram engagement rates
To figure your engagement rates on Instagram, you must do additional calculations or use a third-party software, such as Sharelov, that will calculate engagement rates for you.
Manually calculating your engagement rates:
There are many different opinions on what formulas should be used to calculate your Instagram engagement rates. However, the most important thing to learn is whether your rates are improving, and if so, how quickly?
Some say that engagement rates are calculated with a simple formula of “Likes + Comments divided by # followers = Engagement rate.”
Others argue that this formula is too simple, and offer complicated mathematical formulas.
If you’re just getting started, don’t get sidetracked by the debate over which calculation is best. Keep it simple!
Automatically viewing your engagement rates:
Sharelov’s Instagram analytics includes data on your organic engagement rates and your total organic engagements. This means you can skip the time-consuming calculations needed to figure engagement rates for every single post you publish.
You can access Sharelov post engagement metrics from your dashboard by selecting Analytics>Posts and clicking on any post.
What should your Instagram engagement rate be?
Here’s a look at average engagement rates for Instagram, so you can gauge where you’re at;

For example,
- [tweetshareinline tweet=”If you have less than 1000 followers, your Instagram engagement rate should be at least 10%.” username=”sharelovapp”]
- [tweetshareinline tweet=”If you have between 5000 – 20,000 followers, your Instagram engagement rate should be at least 2.28%.” username=”sharelovapp”]
Generally speaking, [tweetshareinline tweet=”the more Instagram followers you have, the lower your engagement rates will be. This is normal!” username=”sharelovapp”]
The important thing is to monitor your engagement rates on a monthly basis and be sure they’re growing instead of declining. If you do see a decline, take a close look at your Instagram insights to try and find out why your content is performing poorly.
B. How to Calculate and Increase Your Audience Growth Rates
To understand how well your audience is growing, you’ll want to keep an eye on how many new followers you receive each month.
Keep a record of your monthly new follower count in a separate spreadsheet. Down the road you’ll need those numbers, because you’ll probably want to do a more complex calculation to find your precise growth percentage over time.
In the beginning, though, keep building on what you have and check your insights to be sure you’re not losing followers.
If you’re gaining followers, take a deep look into your content insights to see if you can find what type of content is sparking your growth. Give them more of it!
If you’re losing followers, use your insights to determine which posts are losing followers and why.
Adjust your strategy to offer more of what your audience responds to and less of what they don’t.
C. How to Calculate and Increase Your Conversion Rates for Better Profits $$$
Calculating your conversion rates is a joint effort between Instagram Insights and Google Analytics.
To seriously increase your profits, you need to find out what’s happening after an Instagram user clicks on your website link. Are they spending time on your site or bouncing away quickly?
Combine your Instagram Insights and Google Analytics programs to find specific ways you can adjust your call to action, landing page copy, and offers for dramatically-improved conversion rates.
Test. Analyze. Adjust.
[tweetshareinline tweet=”Instagram analytics provide data that can put your business on a solid path to success.” username=”sharelovapp”]
[tweetshare tweet=”If you’re not using Instagram metrics to guide your content efforts, your marketing becomes like a high stakes game of roulette. ” username=”sharelovapp”]You’ll always be crossing your fingers waiting for the next roll.
[tweetshareinline tweet=”Data lays out a structure that improves over time — almost without fail.” username=”sharelovapp”]
Test and analyze the data from Instagram insights metrics, then adjust your social media strategy accordingly.
Know your primary goals and strive to improve interactions with people in your target audience.

Take it to-go! Download the Instagram Cheat Sheet below!