Ever find yourself digging around for Facebook data when you’d rather be creating, brainstorming, or running your business?
Worse, have you ever used statistics to help make critical marketing decisions — only to discover that you’re working with 5 – 10 year old data?
Problem solved! We’ve got 83 current stats you can use to guide your 2019 Facebook writing, decision-making, and post planning.
You can access any statistic quickly by using the jump menu below.
PLUS – you can verify any stat instantly because we’ve linked every piece of data to its source.
We want you to make smart, data-based decisions with the crucial, reliable stats you need to build ads, create content, and plan your marketing campaigns.
Make sure to bookmark this article so you can get here quick when you need it! 🙂
Why Use Facebook for Business?
1. Facebook is currently the 5th most-valuable brand in the world.
2. Globally, it’s the 2nd most-visited multi-platform website (Google properties is #1).
3. In the U.S., Facebook is #1 most popular social channel on the internet.
4. 96% of the U.S. population is aware of Facebook, regardless of whether or not they have internet access
Who’s on Facebook?
How often do people visit Facebook, and who are they? Find out the social habits of Facebook users, plus where they live, how much education they have, how old they are, and more.
How Many People Are On Facebook in 2019?
5. There are approximately 1.56 billion daily active users on Facebook.
6. About 2.38 billion people use Facebook monthly.
Where Do American Facebook Users Live?
7. 66% of adult users live in urban areas
8. 69% of adult users live in suburban areas
9. 66% of adult users live in rural area
How Educated are Facebook Users?
10. 75% of users have some college education
11. 74% of users are college graduates
12. 61% of users have a high school education or less
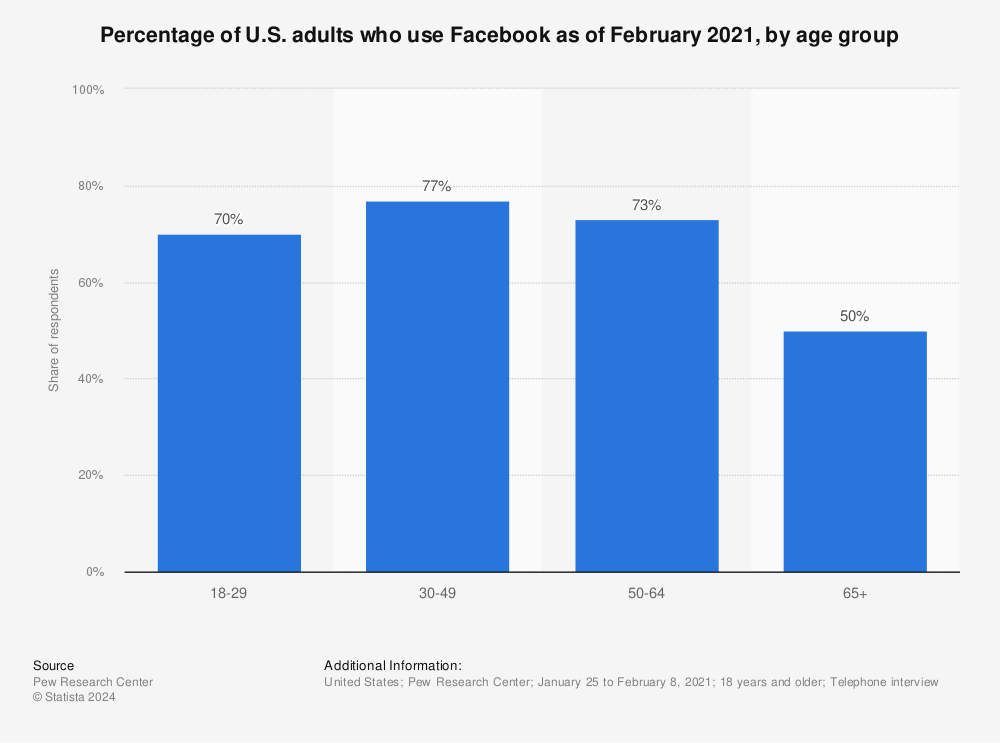
13. 79 % of people ages 18 – 49 use Facebook.
14. 68% of people ages 50 – 64 use Facebook
15. 40% of people ages 65 and older use Facebook
16. Did you know? Most Facebook users are between 25 – 34 years old.

17. 54% of U.S. Facebook users are Women
18. 46% of U.S. Facebook users are Men
19. Teen use of Facebook has dropped by 20% over the past five years.
20. Over half (51%) of people ages 13 – 17 now say they use Facebook, compared to 71% in 2015.
How do People Use Facebook?
Find out what people do when they’re on Facebook, how long they spend on the social platform, how often they like and comment on people’s posts, and more.
What do people do on Facebook?
21. About 40% of adults in the U.S. get news from Facebook. Don’t worry, just because they see news on the social platform doesn’t mean they believe it. In fact…
22. Most American adults (57%) say they think news on social media is INACCURATE.
23. 52% of U.S. consumers have seen a product they’re interested in on Facebook.
24. The typical Facebook user “likes” about 10 posts each month.
25. The typical Facebook user comments on posts about 4 times per month.
26. Users spend an average 58 minutes per day on Facebook – more than any other social network, but only ahead of Instagram by 5 minutes.
How Much Time Do People Spend on Facebook?
27. The average Facebook visit lasts 10 – 12 minutes.
28. 94% of people keep their smartphone with them when watching TV.
29. Users spend about 950 million hours a day on Facebook.

30. 88% of people access Facebook from a mobile device.
31. 95% of people access Facebook with a smartphone or tablet.
32. 32% of people access Facebook using a laptop or desktop
Facebook Video Statistics
33. 85% of Facebook videos are watched without the sound.
34. 80% of Facebook users are annoyed by videos that auto-play sounds.
35. Facebook is the most popular live video platform, and its users spend 3X more time viewing live Facebook live videos than regular Facebook videos.
Facebook Stories Statistics
36. Facebook Stories has 500 million daily users (the same # as Instagram Stories).
37. One-third of Facebook users watch or post at least one Story every day.
38. The top performing Stories ads are less than 10 seconds long
39. 88% of people access Facebook from a mobile device.
40. 95% of people access Facebook with a smartphone or tablet.
41. 32% of people access Facebook using a laptop or desktop

How Do Marketers Use Facebook?
According to Social Media Examiner’s 2019 State of Social Media report, Facebook is the most-used platform by marketers – by a longshot!
43. 94% of marketers use Facebook.
44. 97% of B2C Marketers use Facebook.
45. 91% of B2B Marketers use Facebook (Yes, that’s more than LInkedIn!).
46. 61% of marketers say Facebook is their #1 social platform.
47. 72% of marketers use Facebook advertising.
48. 59% of marketers plan on increasing their Facebook ad spend in 2019 – 2020.

Facebook Engagement Statistics
Find out what compels Facebook users to like, comment, and click.
Data-backed Facebook Engagement Tips
From Buzzsumo’s 1 billion-post study, we discovered:
49. Question and image posts get the most engagement on Facebook.
50. Short messages get more engagement: posts with 50 characters or less get the most engagement on Facebook.
51. Facebook users don’t engage as much if you use hashtags. Posts with no hashtags get more interaction than posts without them!
52. Posting images to Facebook from Instagram boosts their engagement rate by 23%.
53. Headlines with numbers in them get an outrageous amount of engagement compared to all other types of headlines (see chart below).
54. Users love to engage with identity-type headlines. Headlines that reference someone’s identity, or a collective identity, and memes – these type of posts get a much higher-than-average number of shares.

Facebook Advertising Statistics
Plan on boosting your growth and conversions on Facebook? You’ll definitely want to sink a few $$$ into Facebook advertising. Here are some facts all advertisers should know.
How Do Facebook Users Engage With Ads?
55. Facebook ads average click-through rate is 0.90%
56. Facebook ads average conversion rate is an average 9.21%
57. The average Facebook user clicks on 8 ads per month.
58. Women click on an average of 12 Facebook ads per month.
59. Men click on an average of 7 Facebook ads per month.
60. Facebook ad engagement dropped 20% between 2017 and 2018.
How much do Facebook ads cost?
61. Facebook ads average cost-per-click is $1.72
62. Facebook ads average cost-per-action rate is $18.68.
How Can You Improve Your Facebook Ad Performance?
63. Adding a caption to your video ad can increase it’s average view time by 12%.
64. The most popular ad headline length is just four words long.

What Advertisers Should Know About Customer Sentiment Surrounding Data Usage
According to a Pew Research poll conducted in September and October of 2018:
65. About ¾ of Facebook users don’t know their traits and interests are shared with advertisers.
66. 51% aren’t comfortable with the way Facebook tracks and collects their data.
67. 27% say their listings don’t accurately represent them anyway.
68. Facebook users aren’t happy about having their data tracked. The majority (66%) say they have a right to not be tracked.

Facebook Tips and Trivia
Find out how many people work at Facebook, how much money the social platform makes, and how its scandals have affected revenue.

69. 37,700 people work at Facebook full-time as of March 31, 2019.
70. Facebook makes an average of $34.86 per user in the U.S. and Canada, and…
71. Facebook has 7 million advertisers.
72. Facebook Stories has 2 million advertisers.
73. Almost all of Facebook’s ad revenue (93%) comes from mobile.
Here’s how much Facebook made in 2018:
How Did Buyers And Brands React To Facebook Scandals?
76. In November 2018, a Digiday survey learned that 18.7% of Facebook advertisers plan on reducing their ad spend on the platform due to its scandals.
77. The majority of Facebook advertisers, though, didn’t blink an eye at any of last year’s Facebook scandals. According to a Digiday survey published in January 2019:
78. 62.1% of buyers and brands say the scandals wouldn’t have a “material impact” on their spending.
79. 50% said they would increase their spending on Facebook.
78. 62.1% of buyers and brands say the scandals wouldn’t have a “material impact” on their spending.
79. 50% said they would increase their spending on Facebook.
How Have Users Reacted To Facebook Scandals?
80. User confidence dropped by 66% as a result of the Cambridge Analytica scandal.
81. Over half (54%) of adult Facebook users have altered their privacy settings since May 2018.
82. In the past year, 74% of adult Facebook users have taken a break from the platform or deleted the app altogether.
83. 31% of users said they’re likely to cut down on their Facebook usage, or stop using the platform altogether.
How Do You Use Facebook?
Using paid advertising to grow your audience, plus using posts and Stories to engage your audience, is what’s working for most brands today.
Want to learn more about data-backed methods to improve your Facebook performance? Check out any of the following guides below for step-by-step instructions for beginners:
Best Times to Post on Facebook
Definitive Guide to Facebook Stories
How to Use the Facebook DeBugger to Fix Your Blog Post Previews